Forex ABC Pattern Trading Strategy
Forex ABC Pattern Trading Strategy;
The 123 pattern is a reversal chart pattern which occurs very frequently and has a very high success ratio.
123’s occur at the end of trends and swings, and they are an indication of a change in trend. They can also be found within a trading range, and they take place when the directional momentum of a trend is diminishing.
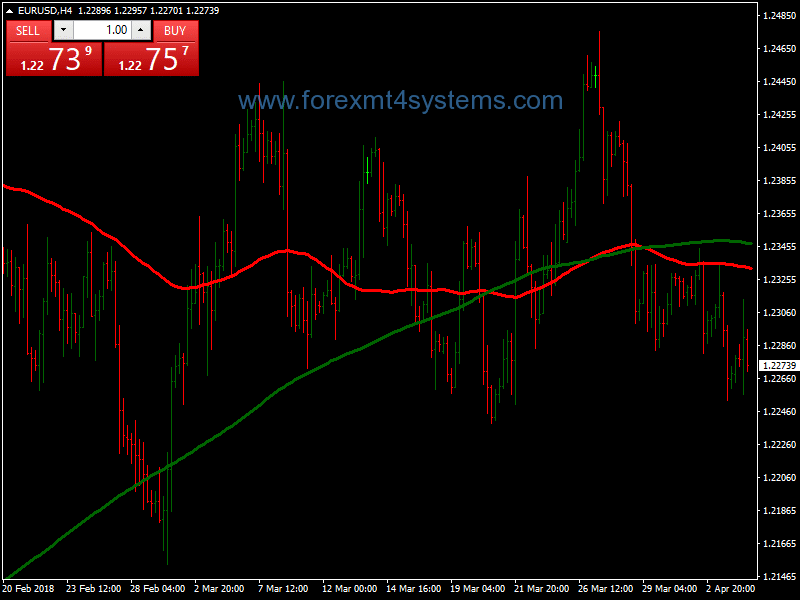
In the above illustrated example, we have a typical 123 formation forming at the end of a downtrend.
Price will make a swing low (point 1), retrace upwards to a swing high (point 2), where a downward correction begins. Price would then form another swing low (point 3), which is higher than the previous low (point 1).
From this higher swing low (point 3) price then resumes the upward movement, thus confirming the change in the trend. A long trade is then entered when price breaks the previous high formed at point 2.
Since this is all that the pattern consists of, it is very easy to spot for a confirmation of the change in trend.
In forex a trading strategy is a fixed plan that is designed to achieve a profitable return by going long or short in markets. The main reasons that a properly researched trading strategy helps are its verifiability, quantifiability, consistency, and objectivity.
For every trading strategy one needs to define assets to trade, entry/exit points and money management rules.
Working of the pattern.
If we look at the fundamental reason for the forming of this pattern, we can see why it works so well. The unfolding of the pattern step wise, would be as follows –
• An indication of the change in trend is seen, when price retraces the original down move.
• Failure to make a new low.
• Price rallying again from here, creating an anticipation of a reversal.
• Breach of the previous high, confirming the reversal.
At this point, everybody is going long creating the extra momentum for the upwards trend.
This is because trader’s, who had anticipated the downtrend to continue, would have placed their stops above point 2 of this pattern. And when these stops are hit, these breakout traders will tend to cover their positions by going long, driving the price up with thrust.
Trade parameters.
Once this pattern has been spotted, let us define some very simple rules for managing the trade.
Entry – The ideal entry should be taken on the break of the point 2 – the previous high (or low as the case maybe)
Stop – The stops to be placed beneath the low of point 1. Aggressive traders may even place the stops below the point 3, but it is always better to give price enough room to move without hitting the stops.
Price targets – While this pattern does not give any projected target, a minimum target can be estimated by the measured move concept.
Calculate the distance from the point 1 to point 2 in the formation. Add this to the low of point 3, and this should be the minimum distance that price will travel to.
Some practical points.
The setup of the entire pattern from point 1 to 3 could take place in 3 bars or as long as 20 bars. But the rules of pattern remain the same.
A point to keep in mind here is that more the number of bars involved in the setup, bigger should be the move. This is not a fixed rule, but more often not, this concept is followed by the price.
Allow the pattern to prove itself before entering a trade. If point 3 forms below point 1, the pattern is negated.
Similarly price has to break the high of point 2 for confirmation.
There will be times when price will consolidate within the area of points 2 & 3, without giving any indications of the direction. At such times it is better to stay out, till price action confirms a direction.
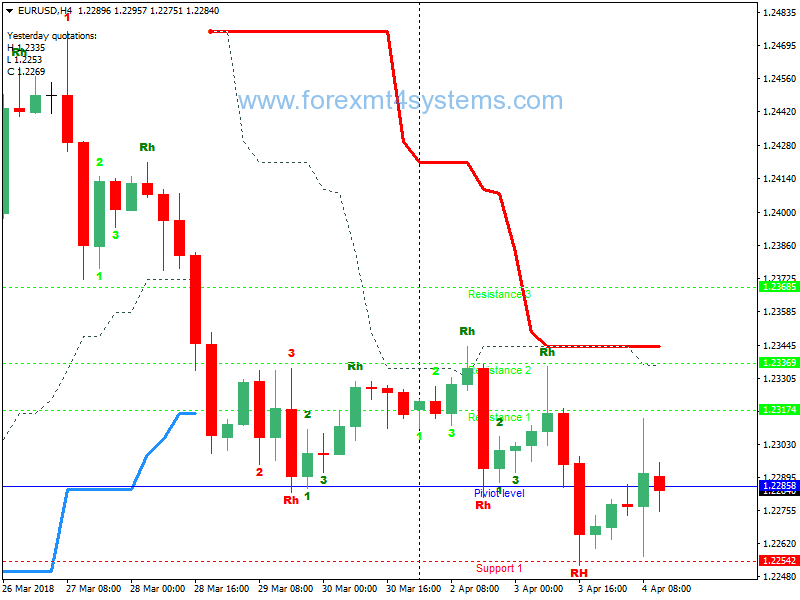
In this example we can see that price was initially in an uptrend. Price then moves down and a simple trend line break will give us the indication of a change of trend. It is here that we label the swing high as point.1 of the formation.
In this new downtrend, we then have a swing low from where price retraces up again in the direction of the previous uptrend. We label this as point.2 of the formation.
Now at this point, even though we have the two initial points of the formation, we are not sure if this is a retracement of the uptrend, or a reversal to the downtrend.
The confirmation comes when price makes a swing high, which is lower than the high of point1 (the point.3). This tells us that price does not have the momentum to break the previous high, thus indicating a change of trend.
If you notice, we mentioned that it only indicates a change of trend. This could just be a consolidation where price could be pausing before resuming the uptrend again. This is where we wait for the confirmation. As soon as price breaks the low of point.2, we enter the trade.
As per our conditions, we place our stops above the point.1 of the formation, and estimate the minimum distance that price should go to. As we can see, price easily surpasses the minimum distance, giving a good short trade.
How to install Forex ABC Pattern Trading Strategy?
- Download Forex ABC Pattern Trading Strategy.zip
- Copy mq4 and ex4 files to your Metatrader Directory / experts / indicators /
- Copy tpl file (Template) to your Metatrader Directory / templates /
- Start or restart your Metatrader Client
- Select Chart and Timeframe where you want to test your forex strategy
- Load indicator on your chart
How to uninstall Forex ABC Pattern Trading Strategy?
To shut down an indicator, one has to remove it from the chart. At that, its drawing and recalculation of its values will stop. To remove an indicator from the chart, one has to execute its context menu commands of “Delete Indicator” or “Delete Indicator Window”, or the chart context menu command of “Indicators List – Delete”.