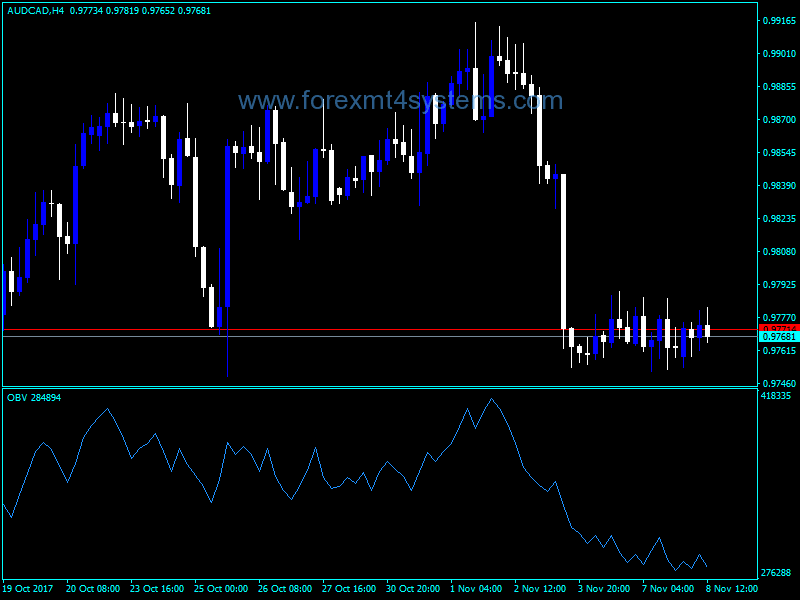
Forex On Balance Volume Indicator
Forex On Balance Volume Indicator (OBV) is a momentum technical indicator that relates volume to price change. The indicator, which Joseph Granville came up with, is pretty simple. When the security closes higher than the previous close, all of the day’s volume is considered up-volume. When the security closes lower than the previous close, all of the day’s volume is considered down-volume.
The basic assumption, regarding On Balance Volume analysis, is that OBV changes precede price changes. The theory is that smart money can be seen flowing into the security by a rising OBV. When the public then moves into the security, both the security and the On Balance Volume will surge ahead.
If the security’s price movement precedes OBV movement, a “non-confirmation” has occurred. Non-confirmations can occur at bull market tops (when the security rises without, or before, the OBV) or at bear market bottoms (when the security falls without, or before, the On Balance Volume Technical Indicator).
The OBV is in a rising trend when each new peak is higher than the previous peak and each new trough is higher than the previous trough. Likewise, the On Balance Volume is in a falling trend when each successive peak is lower than the previous peak and each successive trough is lower than the previous trough. When the OBV is moving sideways and is not making successive highs and lows, it is in a doubtful trend.
Once a trend is established, it remains in force until it is broken. There are two ways in which the On Balance Volume trend can be broken. The first occurs when the trend changes from a rising trend to a falling trend, or from a falling trend to a rising trend.
The second way the OBV trend can be broken is if the trend changes to a doubtful trend and remains doubtful for more than three days. Thus, if the security changes from a rising trend to a doubtful trend and remains doubtful for only two days before changing back to a rising trend, the On Balance Volume is considered to have always been in a rising trend.
When the OBV changes to a rising or falling trend, a “breakout” has occurred. Since OBV breakouts normally precede price breakouts, investors should buy long on On Balance Volume upside breakouts. Likewise, investors should sell short when the OBV makes a downside breakout. Positions should be held until the trend changes.
Calculation
If today’s close is greater than yesterday’s close then:
OBV(i) = OBV(i-1)+VOLUME(i)
If today’s close is less than yesterday’s close then:
OBV(i) = OBV(i-1)-VOLUME(i)
If today’s close is equal to yesterday’s close then:
OBV(i) = OBV(i-1)
where:
- OBV(i) — is the indicator value of the current period;
- OBV(i-1) — is the indicator value of the previous period;
- VOLUME(i) — is the volume of the current bar.On Balance Volume Technical Indicator (OBV) is a momentum technical indicator that relates volume to price change. The indicator, which Joseph Granville came up with, is pretty simple. When the security closes higher than the previous close, all of the day’s volume is considered up-volume. When the security closes lower than the previous close, all of the day’s volume is considered down-volume.The basic assumption, regarding On Balance Volume analysis, is that OBV changes precede price changes. The theory is that smart money can be seen flowing into the security by a rising OBV. When the public then moves into the security, both the security and the On Balance Volume will surge ahead.
If the security’s price movement precedes OBV movement, a “non-confirmation” has occurred. Non-confirmations can occur at bull market tops (when the security rises without, or before, the OBV) or at bear market bottoms (when the security falls without, or before, the On Balance Volume Technical Indicator).
The OBV is in a rising trend when each new peak is higher than the previous peak and each new trough is higher than the previous trough. Likewise, the On Balance Volume is in a falling trend when each successive peak is lower than the previous peak and each successive trough is lower than the previous trough. When the OBV is moving sideways and is not making successive highs and lows, it is in a doubtful trend.
Once a trend is established, it remains in force until it is broken. There are two ways in which the On Balance Volume trend can be broken. The first occurs when the trend changes from a rising trend to a falling trend, or from a falling trend to a rising trend.
The second way the OBV trend can be broken is if the trend changes to a doubtful trend and remains doubtful for more than three days. Thus, if the security changes from a rising trend to a doubtful trend and remains doubtful for only two days before changing back to a rising trend, the On Balance Volume is considered to have always been in a rising trend.
When the OBV changes to a rising or falling trend, a “breakout” has occurred. Since OBV breakouts normally precede price breakouts, investors should buy long on On Balance Volume upside breakouts. Likewise, investors should sell short when the OBV makes a downside breakout. Positions should be held until the trend changes.
Calculation
If today’s close is greater than yesterday’s close then:
OBV(i) = OBV(i-1)+VOLUME(i)
If today’s close is less than yesterday’s close then:
OBV(i) = OBV(i-1)-VOLUME(i)
If today’s close is equal to yesterday’s close then:
OBV(i) = OBV(i-1)
where:
- OBV(i) — is the indicator value of the current period;
- OBV(i-1) — is the indicator value of the previous period;
- VOLUME(i) — is the volume of the current bar.
What does Forex Indicator mean?
A forex indicator is a statistical tool that currency traders use to make judgements about the direction of a currency pair’s price action. Forex indicators come in many types, including leading indicators, lagging indicators, confirming indicators and so on. Popular forex indicators include moving averages, relative strength index (RSI) and average true range (ATR). A forex trader must choose the indicators that fit his or her trading strategy.
How to install Forex On Balance Volume Indicator?
- Download Forex On Balance Volume Indicator.zip
- Copy mq4 and ex4 files to your Metatrader Directory / experts / indicators /
- Copy tpl file (Template) to your Metatrader Directory / templates /
- Start or restart your Metatrader Client
- Select Chart and Timeframe where you want to test your forex indicator
- Load indicator on your chart
How to uninstall Forex On Balance Volume Indicator?
To shut down an indicator, one has to remove it from the chart. At that, its drawing and recalculation of its values will stop. To remove an indicator from the chart, one has to execute its context menu commands of “Delete Indicator” or “Delete Indicator Window”, or the chart context menu command of “Indicators List – Delete”.

