Forex Dolly Graphics Swing Trading Strategy
Forex Dolly Graphics Swing Trading Strategy:
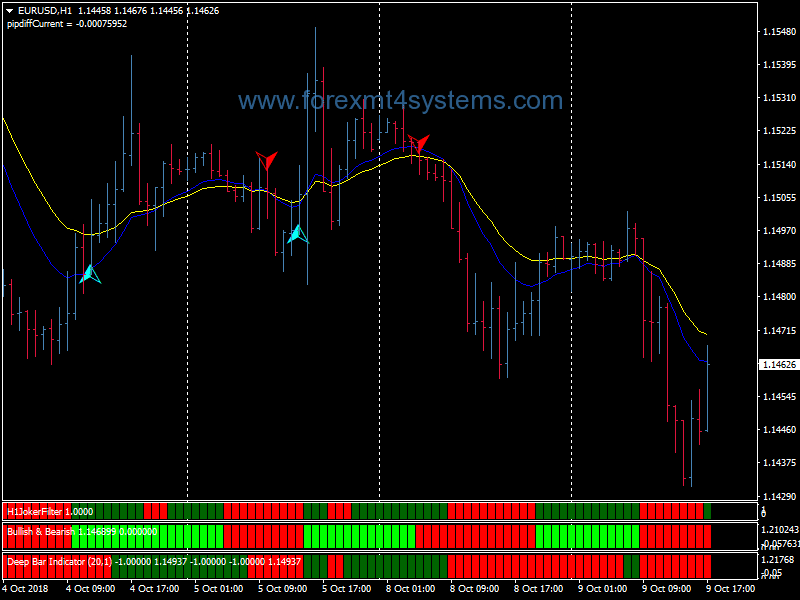
Dolly Graphics 13-dolly14 This indicator has had a total rebuild
and now works with the new extra digit platforms. Some examples
of the built in color displays are shown on the above screenshot.
Dolly now also has Murrey Math 3 MA displays and Bands plus trading signals
and many more features built into the code. Most important is the user
needs to check the Allow DLL imports tab and put a Password into the
Dolly inputs before it will work. Dolly Password = FREE_at_tsd
In the folder there are these MT4 indicators. MACD Candles v4 MACD Candles v4This indicator has had a few revisions of the
code and the MTF display can be altered for size and shifted anywhere on the chart.
The most important update is to the candle color code, in this indicator there is
no need to go into the inputs to alter the candle color width as with most
colored candle indicators, with the latest update the candle size now updates
on the first new tick or you can click on refresh, this version also has an option
to use a fixed manual candle size if required as sometimes when many charts
are displayed in a single window it is possible for the automatic candle size to be
unable to compenstate for the candle size accurately. Price Display Price Display This indicator has several display features the user can select 2
different types of moving Price displays in the form of a Price Box or a simple
Price label and a static Price Display all of which can be altered for size.
The Price color code has been updated to the latest type of code giving a
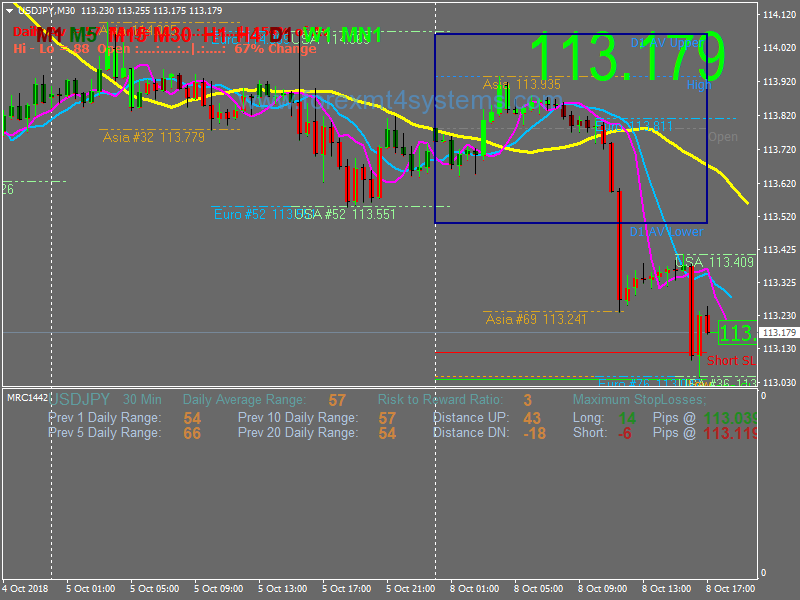
faster response to Price changes. Multi Range Calculator Multi Range Calculator This indicator now has an on chart display of the
LONG and SHORT SL levels and plots the timeframe Average range at 50%
above and below the Open to give an indication of the expected price range for
the selected timeframe. The screenshots shows the Daily Average SL levels
however on the chart which displays the 3 Multi Range Calculator indicators
Daily / H4 / H1 timeframes all of the SL’s for each timeframe or any combination
of the 3 timeframes could be dispalyed on the chart at the same time.
In forex a trading strategy is a fixed plan that is designed to achieve a profitable return by going long or short in markets. The main reasons that a properly researched trading strategy helps are its verifiability, quantifiability, consistency, and objectivity.
For every trading strategy one needs to define assets to trade, entry/exit points and money management rules.
How to install Forex Dolly Graphics Swing Trading Strategy?
- Download Forex Dolly Graphics Swing Trading Strategy.zip
- Copy mq4 and ex4 files to your Metatrader Directory / experts / indicators /
- Copy tpl file (Template) to your Metatrader Directory / templates /
- Start or restart your Metatrader Client
- Select Chart and Timeframe where you want to test your forex strategy
- Load indicator on your chart
How to uninstall Forex Dolly Graphics Swing Trading Strategy?
To shut down an indicator, one has to remove it from the chart. At that, its drawing and recalculation of its values will stop. To remove an indicator from the chart, one has to execute its context menu commands of “Delete Indicator” or “Delete Indicator Window”, or the chart context menu command of “Indicators List – Delete”.