Forex Dual MACD Stochastic Trading System
Forex Dual MACD Stochastic Trading System:
System Overview
Markets Traded – Forex only, but mostly EURUSD and occasionally USDCHF,
GBPUSD, USDJPY, AUDUSD, GBPJPY
Charts – All time frames
Charting Software – MT4
Indicators – My custom KAY-Envelops indicator, Stochastic, MACD, Bollinger
Bands, Weekly Pivot, Fibonacci Retracements and Projections/Expansions,
Trendlines.
Chart Setup
The way I set up the chart, normally, I look at the bigger picture first. In this case,
I will open a higher time frame chart e.g. Daily and Weekly chart. This is good
enough to provide me a longer term direction of the market. If you prefer to trade
the weekly chart, the default higher timeframe is the Monthly chart.
I use the ONE HOUR chart as my trading chart and from time to time, I also look
at the 4 hour chart. Most of the time, I have 1 hour, 30 mins, 15 mins, 5 mins and
1 min chart open at the same time and viewable at one glance. This will help me
to see if the market is still going in the direction of my ONE HOUR chart and
often I exit some of the trade when the 5 or 15 mins chart is going against the
ONE HOUR chart. I sometimes use the lower time frame as my optimum trade
entry/exit area.
The setting of the charts are all the same as per set for the ONE HOUR as
shown below. For the chart, I normally use black color as the background and
white as the foreground. What you see here, is not my normal chart background
setting. This is only shown this way, in order to make it more readable as a
document.
Once you have set up a chart with the relevant indicators, you can then save it as
a template and just simply load the template for other timeframe.
List of indicators used in this strategy are shown below:
Open a 1 Hour chart and then add the following indicators to your chart:
KAY_Envelops (55, 5, 20)
KAY_Supp_Resist_Weekly (10080, 5,35)
Bollinger Bands (20,2, 0)
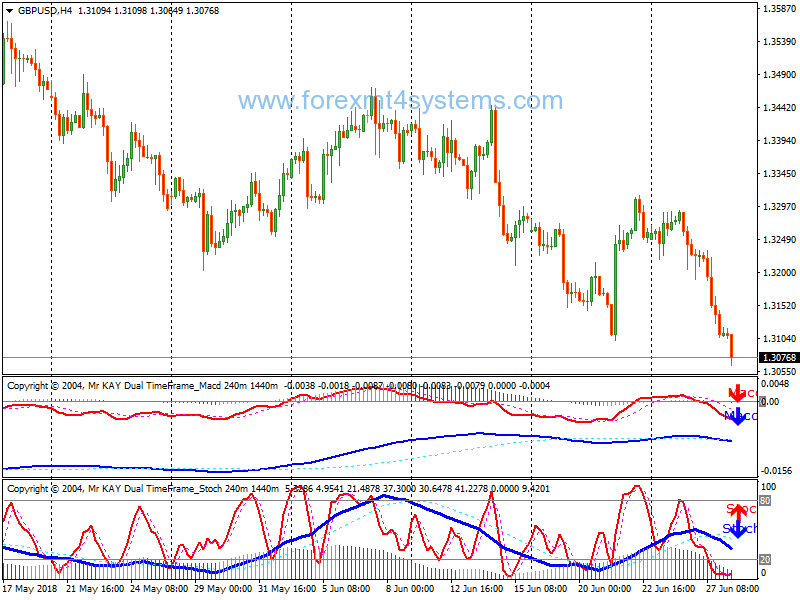
KAY_DualTimeFrameMACD (12,26,9,12)
KAY_DualTimeFrameStoch (8,3,3)
The settings used for each indicator are shown below. It’s fairly self explanatory
but I’ve also listed the settings below each image for your convenience.
System Rules
The generic system rules are as follows:
Short Trades
1. Open a higher time frame chart to provide us the longer term picture of the
market direction i.e. if you are trading the 1 hour chart open the 4 hour
chart at least. Alternatively open the Daily and/or Weekly chart if you
prefer.
2. Use the ONE HOUR chart to examine where the market is in relation to
the KAY Envelops and Weekly Support/Resistance lines.
3. If price hits both of the outermost lines as well as the Weekly
Support/Resistance lines, wait for the market reaction by observing the
Bollinger Bands contraction.
4. If during/after Bollinger Bands contraction, the market is below the Weekly
Support/Resistance, then there is an opportunity is to go SHORT (SELL).
5. Check the KAY Dual TimeFrame MACD if the direction is in agreement, if
it is then standby to enter the market when the KAY Dual TimeFrame
Stochastic is also in agreement with the MACD indicator.
6. If all above are aligned, then use the ONE HOUR Stochastic for entry.
Alternatively, you can also use the lower time frame to time your optimum
trade entry. Normally I open four SELL orders with four different target
levels. My target levels are as follows:
Sell Order 1 Target at the 61.8 Fibonacci Expansion level.
Sell Order 2 Target at the 100.0 Fibonacci Expansion level.
Sell Order 3 Target at the 161.8 Fibonacci Expansion level.
Sell Order 4 Target at the next Resistance line (point 9).
7. Draw a Fibonacci Expansion to determine the 61.8, 100.0 and 1.618
Expansion levels that we will use for our targets.
8. For my exit strategy I normally move my stop loss up as new bars are
formed. If I am SHORT, then I use the highest high of the bars within the
price range as my Stop Loss. You can also use both the outermost KAY
Envelops and Weekly Support/Resistance lines as your STOP LOSS.
9. Set the ultimate profit target on the next higher Weekly
Support/Resistance for SHORT positions.
10. There are a number of different partial trade exits I use. They are (in any
order of preference):
a. ONE HOUR stochastic reverse signal.
b. Break of Trendline.
c. Fibonacci projection levels @ 0.618, 1.00 and 1.618.
d. Stochastic histogram reverse signal.
e. MACD histogram reverse signal.
f. Lower than ONE HOUR timeframe reverse signal especially if the
MACD are all against the trade.
g. Hitting the opposite side of the Most Outer Envelops lines (Or Most
inner for higher time frame or for an early win).
h. Hitting a trailing Stop when Pivot line is hit, based upon the three
previous bars lowest low for LONG trades.
Long Trades
1. Open a higher time frame chart to provide us the longer term picture of the
market direction i.e. if you are trading the 1 hour chart open the 4 hour
chart at least. Alternatively open the Daily and/or Weekly chart if you
prefer.
2. Use the ONE HOUR chart to examine where the market is in relation to
the KAY Envelops and Weekly Support/Resistance lines.
3. If price hits both of the outermost lines as well as the Weekly
Support/Resistance lines, wait for the market reaction by observing the
Bollinger Bands contraction.
4. If during/after Bollinger Bands contraction, the market is above the Weekly
Support/Resistance, then there is an opportunity is to go LONG (BUY).
5. Check the KAY Dual TimeFrame MACD if the direction is in agreement, if
it is then standby to enter the market when the KAY Dual TimeFrame
Stochastic is also in agreement with the MACD indicator.
6. If all above are aligned, then use the ONE HOUR Stochastic for entry.
Alternatively, you can also use the lower time frame to time your optimum
trade entry. Normally I open four BUY orders with four different target
levels. My target levels are as follows:
Buy Order 1 Target at the 61.8 Fibonacci Expansion level.
Buy Order 2 Target at the 100.0 Fibonacci Expansion level.
Buy Order 3 Target at the 161.8 Fibonacci Expansion level.
Buy Order 4 Target at the next Resistance line (point 9).
7. Draw a Fibonacci Expansion to determine the 61.8, 100.0 and 1.618
Expansion levels that we will use for our targets.
8. For my exit strategy I normally move my stop loss up as new bars are
formed. If I am LONG, then I use the lowest low of the bars within the
price range as my Stop Loss. You can also use both the outermost KAY
Envelops and Weekly Support/Resistance lines as your STOP LOSS.
9. Set the ultimate profit target on the next higher Weekly
Support/Resistance for LONG positions.
10. There are a number of different partial trade exits I use. They are (in any
order of preference):
a. ONE HOUR stochastic reverse signal.
b. Break of Trendline.
c. Fibonacci projection levels @ 0.618, 1.00 and 1.618.
d. Stochastic histogram reverse signal.
e. MACD histogram reverse signal.
f. Lower than ONE HOUR timeframe reverse signal especially if the
MACD are all against the trade.
g. Hitting the opposite side of the Most Outer Envelops lines (Or Most
inner for higher time frame or for an early win).
h. Hitting a trailing Stop when Pivot line is hit, based upon the three
previous bars lowest low for LONG trades.
[ NOTE: The Pivot line is generally a place for the market to rest before
continuing the journey in the same trend as previous move, though sometime it
reverses the direction]
On exit strategy, the very first two things to do are to set the initial STOPLOSS
[1] and the ULTIMATE PROFIT TARGET [2].
If you are LONG, then use the lowest low of the bars as your STOP
LOSS[1] and set your ULTIMATE PROFIT TARGET [2] at the next higher
In forex a trading strategy is a fixed plan that is designed to achieve a profitable return by going long or short in markets. The main reasons that a properly researched trading strategy helps are its verifiability, quantifiability, consistency, and objectivity.
For every trading strategy one needs to define assets to trade, entry/exit points and money management rules.
How to install Forex Dual MACD Stochastic Trading System?
- Download Forex Dual MACD Stochastic Trading System.zip
- Copy mq4 and ex4 files to your Metatrader Directory / experts / indicators /
- Copy tpl file (Template) to your Metatrader Directory / templates /
- Start or restart your Metatrader Client
- Select Chart and Timeframe where you want to test your forex strategy
- Load indicator on your chart
How to uninstall Forex Dual MACD Stochastic Trading System?
To shut down an indicator, one has to remove it from the chart. At that, its drawing and recalculation of its values will stop. To remove an indicator from the chart, one has to execute its context menu commands of “Delete Indicator” or “Delete Indicator Window”, or the chart context menu command of “Indicators List – Delete”.