Using Forex EMA Trend Indicator
Forex EMA Trend Indicator is one of the most popular and widely used indicators in forex trading. Its ability to smooth out price fluctuations, identify trends, and provide potential support and resistance levels makes it an invaluable tool for traders. This comprehensive guide will explore how traders can harness the power of EMA to improve their trading strategies.
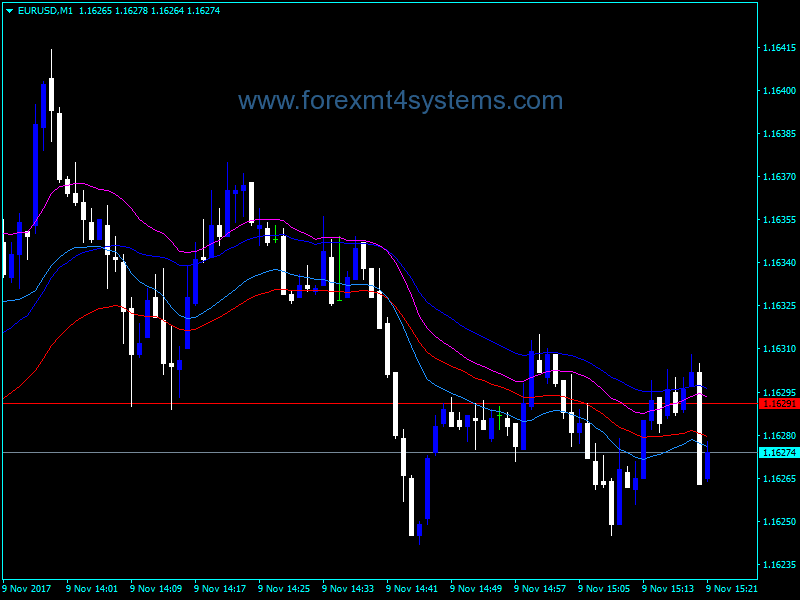
Download Free Forex EMA Trend Indicator
What is Forex EMA Trend Indicator and How is it Calculated?
The Forex EMA Trend Indicator is a type of moving average that places more weight and significance on the most recent price data. Unlike the simple moving average (SMA) which gives equal weight to all data points, the EMA applies an exponential weighting factor that gives greater importance to recent prices.
The exponential moving average is calculated using the following formula:
$$EMA = Price(t) x k + EMA(y) x (1-k)$$
Where:
- t = today/current period
- y = yesterday/previous period
- k = smoothing factor calculated as 2/(selected time period + 1)
For example, for a 10 period EMA, the smoothing factor k = 2/(10+1) = 0.1818
So the EMA gives more weight and relevance to current prices, allowing it to react faster to recent price changes compared to SMA. This responsiveness makes EMA more suitable for short-term traders aiming to capitalize on market swings.
Key Benefits of Using EMA in Forex Trading
There are several advantages of using the exponential moving average indicator in forex analysis and trading strategies:[2]
1. Identifying Trends
The primary use of EMA is to accurately identify the prevailing trend in the forex market. As an indicator that prioritizes the latest price data, EMA effectively smoothes out market noise and isolates the overriding directional bias.
Traders can determine the trend by observing whether the EMA line is sloping up (uptrend) or down (downtrend). This insight into the market trend is invaluable for traders looking to align their trades accordingly.
EMA trend
2. Signaling Potential Trades
In addition to identifying trends, EMA can also provide trade signals to enter and exit positions. The classic EMA crossover system utilizes two EMAs of different timeframes, with the crossover points signaling possible long or short trades.
3. Dynamic Support and Resistance
The EMA line itself often acts as a support or resistance level for price. In an uptrend for instance, as long as price remains above the EMA line it may continue rising higher. But if price breaks the EMA line it could signal a trend reversal.
Therefore, the EMA line provides helpful information regarding where potential support and resistance zones lie.
4. Flexibility in Timeframes
A major advantage of the EMA indicator is that traders can customize it to suit their trading style and strategy by selecting their preferred lookback timeframe. Typically, shorter EMA periods like 10 or 20 are used by short-term traders, while longer 100 or 200 EMAs appeal more to position traders.
This versatility across timeframes and trading horizons makes the EMA widely applicable.
5. Combining with Other Indicators
While potent on its own, the EMA becomes even more robust when combined with other indicators like moving average convergence divergence (MACD), relative strength index (RSI), or Bollinger bands. These complementary indicators help confirm the signals produced by EMA analysis.
So by harnessing EMA as part of a broader indicator toolkit, traders can make better informed trading decisions.
Disadvantages and Limitations of EMA
However, like any trading tool, the exponential moving average also has some weaknesses traders should be aware of:
1. Lagging Indicator
Despite responding faster than SMA to price changes, the EMA is still inherently a lagging indicator since it relies on past data. This means EMA signals will always lag behind the latest market moves. Over-dependence on EMA could cause a trader to miss entering at optimal levels or exiting prematurely.
2. Whipsaws and False Signals
During periods of sideways consolidation or low volatility, the sensitivity of EMA to price fluctuations can generate repeated whipsaws above and below the EMA line. These false signals can trigger erroneous buy and sell trades that hurt performance.
3. Subjectivity in Parameters
The effectiveness of the EMA depends significantly on the parameters chosen by the trader, especially the lookback period. Different EMA settings will produce different results, hints of subjectivity. Traders must experiment to find the optimal EMA parameters for their strategy.
4. Ineffective in Ranging Markets
When the forex market is trading sideways without a clear directional bias, EMA lines tend to flatten out and fail to capture meaningful trends. So EMA may be less useful during non-trending market phases.
How Traders Utilize EMA in Forex Strategies
While acknowledging its drawbacks, traders continue to widely employ EMA analysis to devise profitable forex strategies:
1. Combining EMAs to Confirm Trend
A common tactic is combining a shorter-term EMA like 10 or 20 periods with a longer-term EMA like 50 or 100. The shorter EMA captures short-term swings while the longer EMA defines the broader trend. Traders then look for alignments and crossovers between the two to gauge trend strength.
2. Price Crossovers
Monitoring when price crosses above or below an EMA line also provides trade signals. As long as price trades above the EMA line, the uptrend remains intact. But a crossover below the EMA may signal a trend reversal.
3. Scaling In Near EMA Zone
The EMA line itself tends to act as support or resistance. This helps traders scale into winning trades when price pulls back to the EMA zone instead of chasing the market.
4. Using EMA Ribbons
Some traders stack multiple short, medium, and long-term EMAs into an ‘EMA ribbon’. The overall direction and slope of the ribbon indicates broader trend direction.
These are just some of the common methods traders adopt to harness the flexibility of EMA in their trading tactics.
Real-World EMA Trading Strategies
To demonstrate the practical application of EMA analysis, let’s explore some real-world trading strategies:
1. 5 & 20 EMA Crossover System
This straightforward strategy utilizes two EMAs – a fast 5-period EMA to signal short-term momentum shifts and a slower 20-period EMA to define the overall trend.
Buy rules:
- 5 EMA crosses up through 20 EMA
- Price closes above 20 EMA
Sell rules:
- 5 EMA crosses down through 20 EMA
- Price closes below 20 EMA
The 5 EMA crossing the 20 EMA signals the start of a new uptrend or downtrend. Requiring an additional price close above/below 20 EMA filters whipsaws.
2. 50 & 200 EMA Trend Strategy
A common EMA approach focuses on the 50 & 200 EMA combo to assess long-term trends spanning months or years.
Buy rules:
- Price pulls back to 50 EMA
- 50 EMA trades above 200 EMA
Sell rules:
- Price pulls back to 50 EMA
- 50 EMA trades below 200 EMA
Here the 50 EMA provides dynamic support/resistance to time entries, while the 200 EMA defines prevailing system-wide trend.
3. Triple EMA Ribbon
This ribbon consists of 3 EMAs – 10-period, 20-period, and 50-period EMAs.
Buy rules:
- Ribbon slopes upward (10 EMA on top, 50 EMA at bottom)
- Price pulls back to ribbon zone
Sell rules:
- Ribbon slopes downward (50 EMA on top, 10 EMA at bottom)
- Price pulls back to ribbon zone
The ribbon visually captures both short and long-term trends. Pullbacks to the ribbon provide low-risk entries in the direction of the trend.
These examples demonstrate how traders can customize EMAs across various timeframes to build systematic and rule-based trading strategies.
Common Mistakes to Avoid When Using Forex EMA Trend Indicator
While potent, the EMA indicator can still lead traders astray when used improperly. Some mistakes to avoid include:
1. Acting on a Single EMA
Basing trades on just one EMA in isolation leaves you prone to false signals. Always confirm signals using other EMAs or indicators.
2. Not Customizing EMA Parameters
Blindly applying default EMA settings without optimizing for your timeframe, asset, and strategy diminishes effectiveness.
3. Trading Range-Bound Markets
Avoid using EMA when the forex pair is trading sideways without trends. Whipsaws can hit stop-losses.
4. Over-Reliance on EMA Alone
Depending solely on EMA fails to account for other fundamentals driving price like news events or economic data.
5. Not Confirming Signals
Entering a trade based on a single EMA crossover often leads to failure. Wait for confirmation using other analysis techniques.
Avoiding these common errors allows traders to use EMA effectively as part of their trading process.
Forex EMA Trend Indicator Conclusion
The Forex EMA Trend Indicator for MT4 is one of the most versatile technical indicators used in forex trading. Its ability to smooth price fluctuations, identify dynamic support and resistance levels, signal potential trades, and define trends across timeframes makes it an invaluable tool for traders. While the EMA has some drawbacks like lagging data and false signals, traders continue to depend on it as a core component of their broader analysis. By customizing the EMA to suit their trading style and fine-tuning entry and exit rules, traders can design robust EMA-based trading strategies to extract profits from the forex markets.

