Forex Gann CCI MACD Trading System
Forex Gann CCI MACD Trading System:
Currency pairs: all.
Indicators:
- Gann Hilo Activator indicator (standard period 10)
- CCI (commodity channel index) period 30
- MACD (5,34,9)
- exponential moving average period 50 (50ema)
- Daily pivot (for 1h and below Timeframes)
- Momentum indicator
- Simple moving average period 5 (5sma)
for longs
rule#1: Price has to trade above DP.
rule#2: Price has to close above Gann.
rule#3: Price has to trade above 50ema.
rule#4: CCI (period 30) has to close above the 100 line for longs and below the -100 line for shorts.
rule#5: Price has to be at least 100 pips below a major or strong s/r – fibo level.rule#6: Make sure a bearish HD is not visible when u make a trade.rule#7: it is always BEST to enter at 5sma. if price is over a +50 pips above 5sma don’t enter the trade, wait for it to get there, and when it does check all the rules again before making the decision WHEN price reaches 5sma. The Momentum will give a hint if price is going to retrace (pull back) to 5sma; when going long, and if price is a bit over 5sma AND momentum is pointing down, it usually means that price will have a GOOD chance of going there.rule#8: Exit when price closes below Gann on the TF smaller to the one you’re trading (so if u’re trading, 1h, close ur long when price closes below m30 gann).
Important note:
reaches 5sma. The Momentum will give a hint if price is going to retrace (pull back) to 5sma; when going long, and if price is a bit over 5sma AND momentum is pointing down, it usually means that price will have a GOOD chance of going there.
rule#8: Exit when price closes below Gann on the TF smaller to the one you’re trading (so if u’re trading, 1h, close ur long when price closes below m30 gann).
important note: 5sma represents the REAL price. therefore waiting for 5sma to cross or at least “touch” the last condition for confirmation is better. what this means is for example, if price is alread trading above gann/50ema, and CCI above the 100 line, but price is STILL not above DP, wait for 5sma to at least touch DP, and NOT only price closing above it. this usually yeilds better results and safer entries, because you would avoid fake breakouts. you can apply the same technique on Trendline breakouts.
for shorts: Vice Versa of the above.
this system works 70% of the time (good RR) on ANY TF, m5 and above. i use this system to scalp on m5 and m15 TFs
best TFs are m30 and 1h for intraday trading, and 4h/daily for short/medium term swings.
too many rules? nahhhh, very easy rules and easy to identify. one might think there’s a bunch but when u’re used to them, u’ll make a decision in seconds. think of it as when you first learned how to drive a manual shift; LOTS of things to concentrate on, especially when making a U-Turn, but after a while it becomes so easy that can drive and lid a cigarette while talking to your mistress on your cell phone at the same time (don’t do this at home folks, it’s illegal in some countries
Take Profit and Stop Loss.
intraday swings usually need a 75pip SL at least, and 2% MM. but we will discuss later how to reduce risk and use tighter SLs in my top/bottom picking strategy.
an average setup should yeild at least 100-200 pips.
it is always BETTER to take partial profit when you see a good S/R level in the way, and raise (or lower) ur SL accordingly. remember, this is not only a game of making money, it’s a game of STAYING IN the market for a long period of time!
Details
rule #1: CCI period 30 is our eyes and ears for trend detection. when CCI is over the 100 line on the weekly chart, the medium/long term trend is bullish. when CCI is below the -100 line on the weekly chart, the medium/long term trend is bearish. the trends stays bearish/bullish unless the other end of CCI is taken out and maintained for 1-2 weeks at least. price has to trade above 50ema for bullish confirmation, or below 50ema for bearish confirmation.
something worth mentioning about CCI 30. when CCI is above the 100 line, it DOES NOT mean that price is overbought, it simply means breakout. it doesn’t matter how high it gets. i will post notes if i see something “unusual”.
please apply the first rule to all timeframes with confirmation of the higher timeframe. the highest needed is the weekly chart, no need for monthly confirmation.
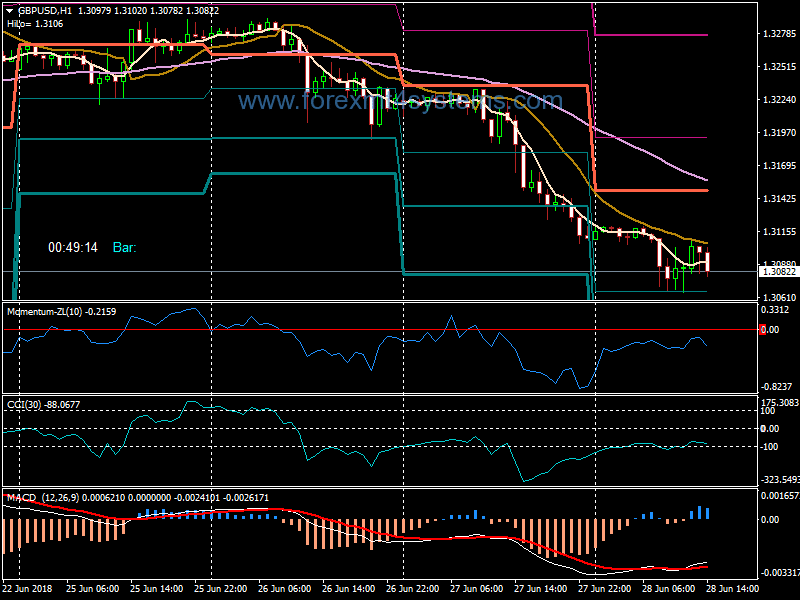
rule #2: when CCI and/or MACD detect a classic divergence while price is touching a strong SR level when CCI is below/above the -100/0/100 line (in that established trend), price tends to “seek” 50ema of that timeframe IF CCI makes it back above/below the -100/0/100 lines. classic divergence is confirmed when a trendline is broken (example in chart). a classic divergence is not necessary for this to happen, but in most cases it does.
so for example, in this chart, price was below the -100 line, but while it was retracing, it made it back above the -100 line signalling a breakout and a retracement to 50ema on the weekly chart.
rule #3: when price approaches 50ema, watch for a hidden divergence. if a hidden divergence is present, price tends to bounce again and go back to it’s major direction. a stronger signal is when CCI bounces from the -100/0/100 lines. if however, price makes it through 50ema, watch for the closest and most reliable S/R-fibo level. this pattern is valid unless the divergence is broken.
example: take a look at that chart. the bearish HD was visible on MACD, coupled with a bounce from the 100 line. STRONG short signal, signaling a very high possibility of taking out the lows. which it did. PERFECT top picking
rule #4: in some instances when a hidden divergence forms on a Timeframe where price has already taken out 50ema, that divergence would most probably reverse price when price reaches the higher TF’s Gann Line and/or 50ema.
There are also instances where 50ema of the higher timeframe is not in the same direction (meaning price aready took it out too), that’s when price targets the previous peak (high or low), and a bounce from there is highly probable. If by any chance the previous peak is taken out, then that would mean the hidden divergence is broken, and price is setting itself for a reversal.
example, we’re looking at the 1h TF, and suddenly we see a bearish HD when price is rising. if price has already taken out 1h 50ema, then the target should be 4h gann or 4h 50ema.
In forex a trading strategy is a fixed plan that is designed to achieve a profitable return by going long or short in markets. The main reasons that a properly researched trading strategy helps are its verifiability, quantifiability, consistency, and objectivity.
For every trading strategy one needs to define assets to trade, entry/exit points and money management rules.
How to install Forex Gann CCI MACD Trading System?
- Download Forex Gann CCI MACD Trading System.zip
- Copy mq4 and ex4 files to your Metatrader Directory / experts / indicators /
- Copy tpl file (Template) to your Metatrader Directory / templates /
- Start or restart your Metatrader Client
- Select Chart and Timeframe where you want to test your forex strategy
- Load indicator on your chart
How to uninstall Forex Gann CCI MACD Trading System?
To shut down an indicator, one has to remove it from the chart. At that, its drawing and recalculation of its values will stop. To remove an indicator from the chart, one has to execute its context menu commands of “Delete Indicator” or “Delete Indicator Window”, or the chart context menu command of “Indicators List – Delete”.