Understanding the Haos Visual Indicator for Forex Trading
The Haos Visual indicator is a popular technical analysis tool used by forex traders to identify potential trend changes and trading opportunities. This indicator provides a visual representation of market sentiment and momentum, making it easy to spot overbought and oversold conditions.
In this comprehensive guide, we will cover everything you need to know about the Haos Visual indicator, including:
- What is the Haos Visual Indicator?
- How Does the Haos Visual Indicator Work?
- Key Features and Settings
- How to Interpret the Haos Visual Indicator
- Trading Strategies Using the Haos Visual
- Pros and Cons
- Tips for Effective Usage
Equipped with this knowledge, you will be able to utilize the Haos Visual indicator effectively in your own forex trading.
Download Free Forex Haos Visual Indicator
What is the Haos Visual Indicator?
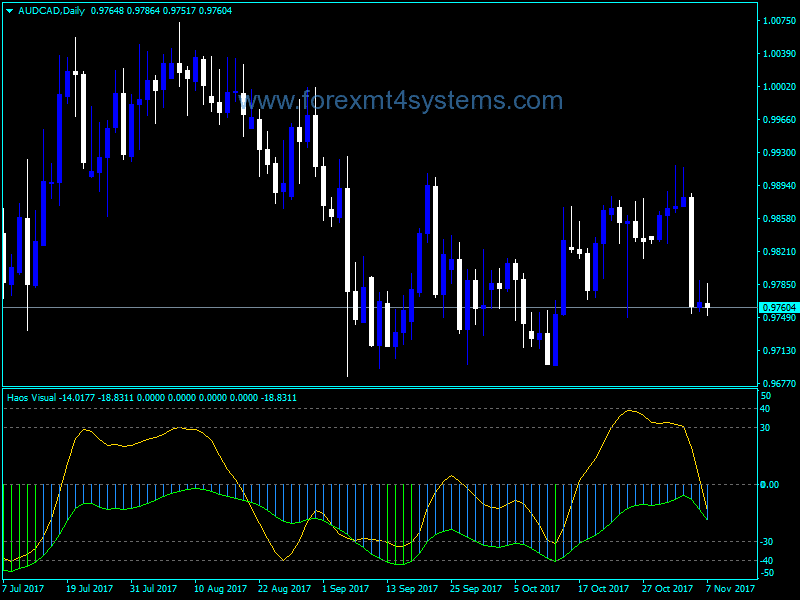
The Haos Visual indicator was created by trader Haos and combines two William’s Percent Range indicators with different time periods. It features a histogram that oscillates above and below a zero level midpoint, along with a signal line.
The main function of this indicator is to identify potential price reversals and show overbought/oversold levels in the forex market. It aims to measure market sentiment and momentum to highlight the “chaos” that often precedes a trend change.
The histogram bars and signal line work together to generate simplified trade signals – making the Haos Visual easy to interpret for beginners while still providing valuable insights for experienced traders.
How Does the Haos Visual Indicator Work?
The key to understanding the Haos Visual indicator is to analyze the relationship between the histogram bars and the signal line:
The Histogram
- Bars above the zero line indicate bullish sentiment
- Bars below the zero line indicate bearish sentiment
- The color and size of bars shows the market momentum
The Signal Line
- Crossing above -50 signals potential buying opportunity
- Crossing below -50 signals potential selling opportunity
By combining these elements, the indicator identifies reversal points and displays clear entry and exit signals. When the histogram bars switch direction and the signal line crosses key thresholds, it suggests that a trend change may be ahead.
The indicator takes raw price data and processes it into an easy-to-interpret visual format – allowing traders to make quick decisions without needing complex analysis.
Key Features and Settings
The Haos Visual comes with several customizable settings that allow traders to adjust the indicator to suit their preferences:
WPR Period: Adjusts the number of periods used in the Williams %R calculations
Signal Period: Changes the number of periods used for the signal line
Histogram Mode: Toggles between regular and filled histogram style
Signal Mode: Switches between showing one signal line or separate buy/sell signals
Signal Arrows: Adds arrow markers for signal confirmation
The default parameters (WPR Period 14, Signal Period 7) are suitable for most trading purposes. However, traders can experiment to find settings that match their strategy.
The indicator can be applied across all timeframes and currency pairs. Shorter periods tend to work better for lower timeframes and day trading, while longer periods are more reliable for swing trading on higher timeframes.
How to Interpret the Haos Visual Indicator
When added to a forex chart, the Haos Visual produces a histogram panel with the following key elements:
Histogram Bars: The color and direction of bars indicates market sentiment. Green bars reflect bullishness, while red bars indicate bearish sentiment.
Signal Line: This line oscillates from top to bottom thresholds, providing trade signals when crossed. Values above -50 signal upward momentum, while values below -50 signal downward momentum.
Zero Level: Acts as an equilibrium point. Price tends to revert back to this level after extensions up or down.
Signal Arrows: These optional arrows appear when the signal line crosses above or below the key -50 level, confirming potential entry signals.
By analyzing the interaction between these components, traders can determine high probability entry and exit points in the market.
The most basic signals occur when the histogram bars change color and the signal line crosses the -50 threshold in the direction of the new trend. Additional confirmation comes from the relationship between the signal line and histogram – they should be moving in the same direction.
Trading Strategies Using the Haos Visual
The Haos Visual indicator can be incorporated into many different forex trading strategies, including:
Trend Trading
Use the histogram bars to determine the dominant market trend. Then look for signal line crosses to indicate trend resumption entry points.
Range Trading
When histogram bars fluctuate near the zero level with no clear direction, it indicates ranging conditions. Trade the range by buying near support when the signal line crosses up and selling near resistance when it crosses down.
Reversal Trading
Powerful reversal signals occur when the histogram bars change color and the signal line crosses back through the -50 threshold. Enter in the direction of the new trend once this reversal signal is confirmed.
Breakout Trading
The indicator often foreshadows breakouts with widening histogram bars leading up to the actual price break. Confirm a pending breakout with a supporting signal line cross.
No matter what strategy is used, the Haos Visual provides clear visual signals that can boost trading performance.
Pros and Cons of the Haos Visual Indicator
Here are some key advantages and disadvantages when using the Haos Visual in forex trading:
Pros
- Identifies overbought and oversold levels
- Spots trend reversals and breakouts early
- Simplifies analysis with clear entry signals
- Easy to read visual format
- Works across all currency pairs and timeframes
Cons
- Can generate false signals during ranging or choppy markets
- Performs best when used with other indicators for confirmation
- Limited customization options
- Lagging indicator by nature
Overall, the indicator excels at signaling high probability turning points in trends – making it extremely useful for timing trade entries. But traders should employ prudent risk management techniques and confirm signals on multiple timeframes.
Tips for Effective Usage
Here are some tips to use the Haos Visual effectively:
- Combine it with a price action indicator like candlestick patterns for added confirmation
- Use on multiple timeframes to identify the dominant trend direction
- Be cautious trading signals against the main trend
- Adjust the WPR periods to match the timeframe
- Use longer signal periods for smoother crossovers
- Wait for clear change in histogram direction before acting
- Employ sound risk-reward principles for all trades
With the right usage techniques, the Haos Visual can significantly boost your trading accuracy. But like with any indicator, it should not be relied on entirely. Use it as part of a broader trading plan for the best results.
Conclusion
The Haos Visual for MetaTrader 4 delivers high-probability reversal trade signals through an intuitive visual format. By spotlighting overextended market moves, it helps traders pinpoint opportune entry points.
We have covered everything from the working mechanisms behind the indicator to professional trading strategies using it. So you now have all the necessary knowledge to unleash the full potential of the Haos Visual in your own forex trading.
Used responsibly, this indicator can guide you to better trades. Just remember to always exercise prudent risk management on every position.

