Forex Ichimoku Kinko Hyo Indicator
Forex Ichimoku Kinko Hyo Indicator is predefined to characterize the market Trend, Support and Resistance Levels, and to generate signals of buying and selling. This indicator works best at weekly and daily charts.
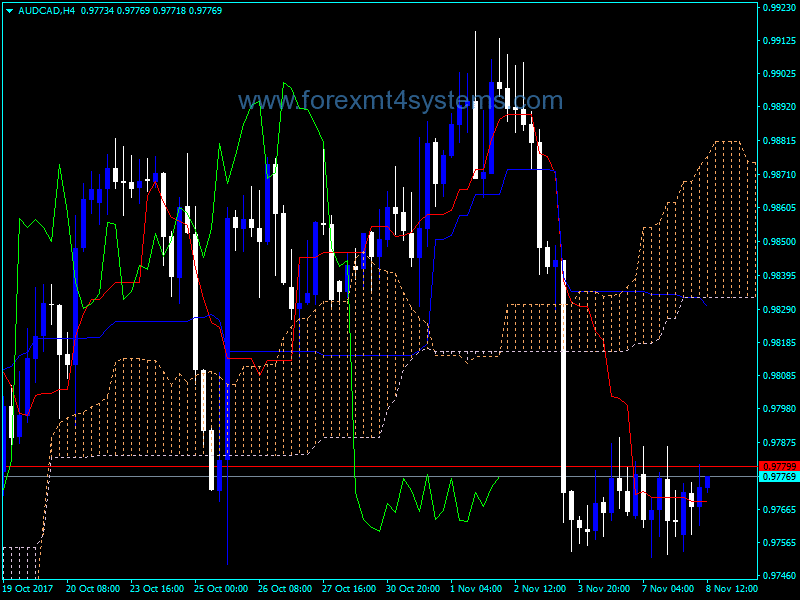
When defining the dimension of parameters, four time intervals of different length are used. The values of individuallines composing this indicator are based on these intervals:
- Tenkan-sen shows the average price value during the first time interval defined as the sum of maximum and minimum within this time, divided by two;
- Kijun-sen shows the average price value during the second time interval;
- Senkou Span A shows the middle of the distance between two previous lines shifted forwards by the value of the second time interval;
- Senkou Span B shows the average price value during the third time interval shifted forwards by the value of the second time interval.
Chikou Span shows the closing price of the current candle shifted backwards by the value of the second time interval. The distance between the Senkou lines is hatched with another color and called “cloud”. If the price is between these lines, the market should be considered as non-trend, and then the cloud margins form the support and resistance levels.
- If the price is above the cloud, its upper line forms the first support level, and the second line forms the second support level;
- If the price is below cloud, the lower line forms the first resistance level, and the upper one forms the second level;
- If the Chikou Span line traverses the price chart in the bottom-up direction it is signal to buy. If the Chikou Span line traverses the price chart in the top-down direction it is signal to sell.
Kijun-sen is used as an indicator of the market movement. If the price is higher than this indicator, the prices will probably continue to increase. When the price traverses thisline the further trend changing is possible.
Another kind of using the Kijun-sen is giving signals. Signal to buy is generated when the Tenkan-sen line traverses the Kijun-sen in the bottom-up direction. Top-down direction is the signal to sell.
Tenkan-sen is used as an indicator of the market trend. If this line increases or decreases, the trend exists. When it goes horizontally, it means that the market has come intothe channel.
What does Forex Indicator mean?
A forex indicator is a statistical tool that currency traders use to make judgements about the direction of a currency pair’s price action. Forex indicators come in many types, including leading indicators, lagging indicators, confirming indicators and so on. Popular forex indicators include moving averages, relative strength index (RSI) and average true range (ATR). A forex trader must choose the indicators that fit his or her trading strategy.
How to install Forex Ichimoku Kinko Hyo Indicator?
- Download Forex Ichimoku Kinko Hyo Indicator.zip
- Copy mq4 and ex4 files to your Metatrader Directory / experts / indicators /
- Copy tpl file (Template) to your Metatrader Directory / templates /
- Start or restart your Metatrader Client
- Select Chart and Timeframe where you want to test your forex indicator
- Load indicator on your chart
How to uninstall Forex Ichimoku Kinko Hyo Indicator?
To shut down an indicator, one has to remove it from the chart. At that, its drawing and recalculation of its values will stop. To remove an indicator from the chart, one has to execute its context menu commands of “Delete Indicator” or “Delete Indicator Window”, or the chart context menu command of “Indicators List – Delete”.

