Forex Lindencourt MX Trend Following Strategy
Forex Lindencourt MX Trend Following Strategy;
TF:15 Minutes.
Pairs: All.
Indicators:
- Simple Moving Average 7, 21, 84, 336
- CCI (5)
BUY Trades
The following conditions need to be met on the 15M charts to enter a BUY trade. If any one of the conditions has not been met, there is simply NO TRADE using this method.
Condition 1
The black MA (“MA(7)”) needs to cross above the blue MA (ie, the “MA(21)”) indicating a change in the trend. It is important to wait until the end of the 15M candle forming the cross to confirm that a MA cross has in fact occurred.
Condition 2
At the same time as the two MAs cross above, the CCI(5) also needs to cross above the “0” line at the start of the same 15M candle for there to be a valid BUY trade.
NB. We can allow ± 1 x candle for the two crosses to occur, eg, if the MAs cross on a candle @ 8.00hrs, the CCI cross of the “0” line must occur either on the same price candle at 8.00hrs, or on the 7.45hrs candle, or on the 8.15hrs candle. You would enter only when the two conditions have been met so for the latter it would be an 8.15 hrs entry. If the two crosses occur ± 2 candles apart, eg, one cross at 7.45hrs and the other cross at 8.15 hrs the setup is invalid.
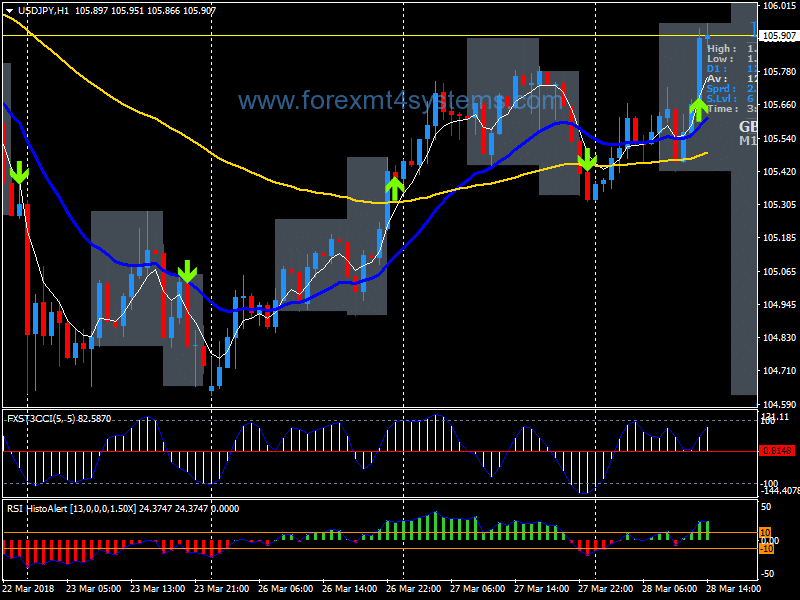
Let’s now put this all together and look at an example BUY trade on a 15M chart.
For this Lindencourt FX Method, we do not take account of the red MA or the RSI Histogram indicator to determine whether to place a trade or not.
In the above example on the USDCAD the MAs crossed between 13.15 and 13.30 hrs GMT. TheMA cross was confirmed when the subsequent candle closed, which was at 13.30 hrs. The trade was valid as the CCI line crossed the “0” line between 13.00 and 13.15 hrs. A BUY trade was entered at the start of the 13.45 hrs candle at 1.0780.
The trade was closed when a 15M candle finally closed below the black MA (7) trend line, as well as the CCI crossing back below the “0” level. In this case it was at 1.0900 for +120 pips profit.
Similar to the Lindencourt FX System, the stop loss was placed c.30 pips away from the entry price and was subsequently moved to break even (ie the entry price) as soon as practicable – when the trade was c.20-30 pips in profit.
Exiting with the Lindencourt MX Method
Unlike the Lindencourt FX System exit rules, I tend to exit a Lindencourt FX trade with just two partial exits, because of the increased probability of the trade being a successful trade – exit 50% of the trade when c.25-30 pips in profit (and move the stop loss to break even), and exit the remaining 50% when a candle closes below the MA(7) trend line.
You will notice that in the trade above, the entry point was also the same point for a Lindencourt FX System BUY trade. As I previously mentioned, this will happen on most MX trades.
SELL Trades
The following conditions need to be met on the 15M charts to enter a SELL trade. If any one of the conditions has not been met, there is simply NO TRADE using this method.
Condition 1
The black MA (“MA(7)”) needs to cross below the blue MA (ie, the “MA(21)”) indicating a change in the trend. It is important to wait until the end of the 15M candle forming the cross to confirm that a MA cross has in fact occurred.
Condition 2
At the same time as the two MAs cross below, the CCI(5) also needs to cross below the “0” line at the start of the same 15M candle for there to be a valid SELL trade.
NB. We can allow ± 1 x candle for the two crosses to occur, eg, if the MAs cross on a candle @ 8.00hrs, the CCI cross of the “0” line must occur either on the same price candle at 8.00hrs, or on the 7.45hrs candle, or on the 8.15hrs candle. You would enter when the two conditions have been met, so for the latter it would be an 8.15 hrs entry. If the two crosses occur ± 2 candles apart, eg one cross at 7.45hrs and the other cross at 8.15 hrs, the setup is invalid and there is no trade using this method (however, there might be a potential setup forming using the Lindencourt FX system rules).
For this Lindencourt FX Method, we do not take account of the red MA or the RSI Histogram indicator to determine whether to place a trade or not.
In forex a trading strategy is a fixed plan that is designed to achieve a profitable return by going long or short in markets. The main reasons that a properly researched trading strategy helps are its verifiability, quantifiability, consistency, and objectivity.
For every trading strategy one needs to define assets to trade, entry/exit points and money management rules.
How to install Forex Lindencourt MX Trend Following Strategy?
- Download Forex Lindencourt MX Trend Following Strategy.zip
- Copy mq4 and ex4 files to your Metatrader Directory / experts / indicators /
- Copy tpl file (Template) to your Metatrader Directory / templates /
- Start or restart your Metatrader Client
- Select Chart and Timeframe where you want to test your forex strategy
- Load indicator on your chart
How to uninstall Forex Lindencourt MX Trend Following Strategy?
To shut down an indicator, one has to remove it from the chart. At that, its drawing and recalculation of its values will stop. To remove an indicator from the chart, one has to execute its context menu commands of “Delete Indicator” or “Delete Indicator Window”, or the chart context menu command of “Indicators List – Delete”.