Forex Linear Momentum Indicator: A Comprehensive Review
The Forex Linear Momentum Indicator is a popular technical analysis tool used by traders to identify trends and momentum in the foreign exchange market. This indicator measures the rate of change in a currency pair’s price over a specified period of time.
Download Free Forex Linear Momentum Indicator
How the Forex Linear Momentum Indicator Works
The Linear Momentum Indicator is based on the principle that market prices tend to continue moving in the same direction rather than suddenly reversing course. It aims to identify periods when a currency pair is gaining or losing momentum as part of an emerging trend.
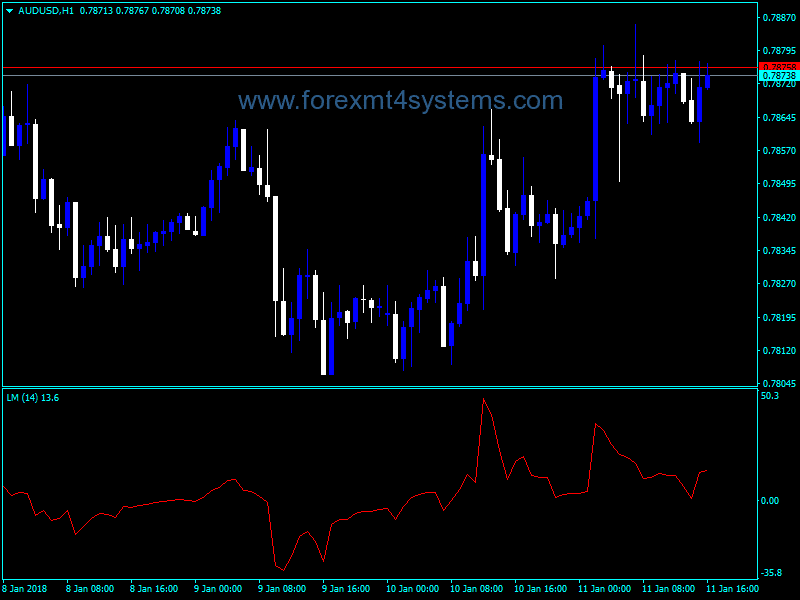
The indicator calculates the difference between the closing price of a currency pair today compared to its closing price N days ago. The standard setting for N is 14, but this can be adjusted based on the trader’s preferences.
The basic formula for the Forex Linear Momentum Indicator is:
Momentum = (Current Close - Close N periods ago) / Close N periods ago
If the current close is higher than the close N days ago, the momentum value will be positive, indicating an uptrend. If the current close is lower, the momentum value will be negative, indicating a downtrend.
The greater the absolute value of the momentum, the stronger the emerging trend. Values approaching zero indicate a lack of directional momentum in the currency pair.
Key Benefits of the Linear Momentum Indicator
Some of the key benefits of using the Linear Momentum Indicator in forex trading include:
- Identifying new trends early: The indicator can spot emerging trends by measuring accelerating price movement in either direction. This allows traders to get in at the start of a new uptrend or downtrend.
- Confirming trend strength: The indicator helps confirm whether an ongoing trend has strength by measuring the rate of change in prices. Strong momentum supports staying with the prevailing trend.
- Spotting trend reversals: Fading momentum warns of a potential trend reversal. Divergence between price and the indicator can signal the end of a trend.
- Defining overbought/oversold levels: The indicator can identify periods where a currency pair may be overextended after a strong run up or down.
- Trading with the trend: Using the momentum indicator keeps traders on the right side of the market by avoiding trades against the prevailing trend.
Using the Linear Momentum Indicator in Forex Trading
The Linear Momentum Indicator for MT4 can be used in various ways as part of a forex trading strategy:
- Look for the indicator to move above its centerline to signal an emerging uptrend. Go long on a currency pair when the indicator crosses above zero or crosses back above its centerline after a brief dip below it.
- Go short when the indicator crosses below its centerline, signaling a new downtrend. Sell a currency pair when the indicator crosses below zero or crosses back below its centerline after briefly poking above it.
- Look for divergence between the indicator and price to spot potential trend reversals. If price is making new highs but the indicator is failing to confirm with new highs of its own, be alert for a reversal lower.
- Combine the indicator with chart patterns or other technical analysis tools for higher probability trades. For example, trade pullbacks to the 20-period moving average when momentum is strongly positive.
- Use overbought/oversold readings to identify exhaustion moves and profit-taking opportunities within the trend. For example, consider taking partial profits when the indicator reaches extremely high overbought levels after an extended uptrend.
Optimizing the Linear Momentum Indicator
The standard period setting of 14 works well for the Linear Momentum Indicator on daily charts. However, traders can experiment with shorter or longer settings for greater sensitivity or smoothness in the indicator line. Some guidelines include:
- Faster settings (5-10 periods): More sensitive for very short-term trends and reversals, but prone to more whipsaws. Best for active traders and scalpers.
- Moderate settings (10-20 periods): Offer a balance between responsiveness and smoothness. Works for both swing trading and shorter-term day trading.
- Longer settings (20-30 periods): Smoother line with fewer false reversals. Ideal for position traders and long-term trend followers.
It’s also advisable to test the indicator across multiple time frames to find the settings that match your trading style and timeframe preferences. Optimizing the indicator can improve timing on entries and exits.
Using Additional Confirmation Indicators
While the Linear Momentum Indicator offers valuable trend and momentum insights on its own, accuracy can be enhanced by combining it with additional technical indicators:
- Moving averages act as dynamic support/resistance as well as trend filters. Trading in the direction of the 50- or 200-period moving average when momentum agrees enhances odds of success.
- The Average Directional Index (ADX) helps confirm the strength of a trend. High ADX readings above 25 suggest a strong trend that is ideal for momentum trading.
- Oscillators like MACD and RSI can define overbought/oversold levels. Trading momentum in the direction of extremes can optimize entries.
- Volume indicators confirm that momentum is aligned with buying/selling pressure. Volume should expand when the market moves in the direction of the momentum indicator.
Multiple time frame analysis also helps improve the accuracy of momentum trading. Always trade in alignment with the higher time frame trend.
The Risks of Trading Momentum
While trading with momentum can boost profits during strong trends, traders should be aware of the following risks:
- Whipsaws: Momentum can whip back and forth during choppy, range-bound markets. This results in stopped out trades. It’s best to avoid momentum trading when the ADX is below 25.
- False breakouts: The indicator may spike during false breakouts, generating losing trades if acted upon. Wait for confirmation from other indicators before trading breakouts.
- Divergences: Spotting divergences is challenging. Hidden divergences when both price and momentum are rising/falling can lead to late exits.
- Over-optimization: Curve fitting will fail out of sample. Avoid excessive tweaking of the indicator’s settings.
- Late exits: Trends persist longer than expected. Allow some give in exits to capture the meat of the move.
Proper risk management, position sizing, and the use of stop losses helps reduce the risks when momentum trading.
Conclusion
The Linear Momentum Indicator is a versatile tool that can help forex traders identify new trends early, gauge trend strength, spot imminent reversals, and make higher probability trading decisions. Optimizing the indicator and combining it with other technical analysis methods can further improve performance. While momentum trading has risks, these can be managed by employing sound risk practices. Overall, the Linear Momentum Indicator should be a part of every forex trader’s analysis toolkit.

