Forex Moving Average of Oscillator (OsMA) Indicator: A Comprehensive Review
The Moving Average of Oscillator (OsMA) is a technical analysis indicator used in the foreign exchange (forex) market to help traders identify overbought and oversold conditions as well as trend reversals. This review provides an in-depth look at the OsMA MT4 indicator, including how it is calculated, how to interpret its signals, strategies for trading with OsMA, and the advantages and disadvantages of using this tool.
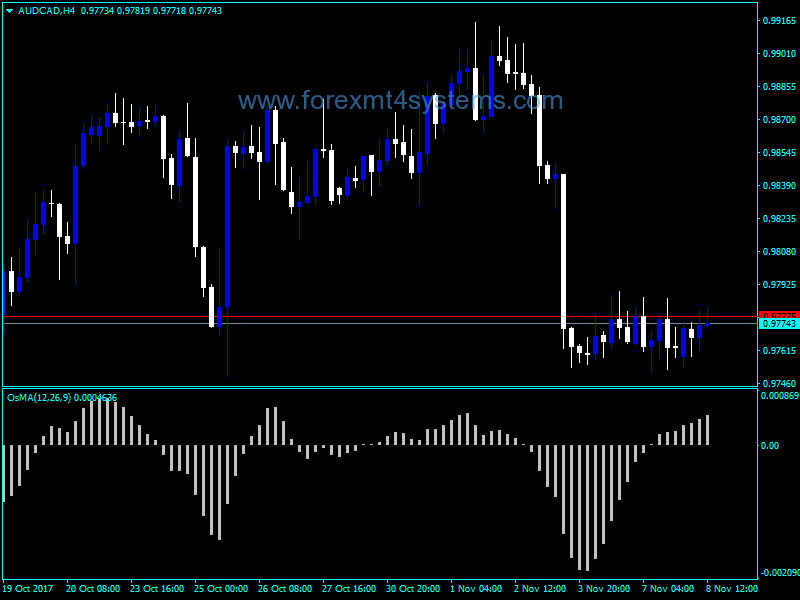
Download Free Forex Moving Average of Oscillator OsMA Indicator
What is the Moving Average of Oscillator (OsMA)?
The OsMA indicator reflects the difference between an oscillator and its moving average over a given period of time. It is displayed visually on a chart as a histogram oscillating above and below a centerline at zero. The most common oscillator used in the OsMA’s calculation is the Moving Average Convergence Divergence (MACD).
The MACD itself consists of two exponential moving averages (EMAs):
- A 12-period EMA
- A 26-period EMA
The MACD line plots the difference between these two EMAs. The signal line is a 9-period EMA of the MACD line. The OsMA then plots the difference between the MACD line and signal line as a histogram.
The formula is:
OsMA = MACD line – Signal line
Positive OsMA values mean the MACD line is above its signal line, while negative values mean it is below. As the MACD line diverges further from its signal line, the OsMA histogram gets taller or shorter. The indicator oscillates above and below zero based on this relationship.
How is the Moving Average of Oscillator Calculated?
The steps to calculate the OsMA are:
- Select an oscillator (typically the 12/26 MACD)
- Select a moving average for the oscillator’s signal line (typically a 9-period EMA of the MACD line)
- Calculate the oscillator value (MACD line)
- Calculate the moving average of the oscillator (signal line)
- Subtract the signal line from the oscillator line to get the OsMA value
- Plot the difference as a histogram oscillating above/below zero
- Repeat for each new period
The most common parameters used are:
- 12-period EMA for the fast MACD line
- 26-period EMA for the slow MACD line
- 9-period EMA of the MACD line for the signal line
How to Interpret OsMA Signals
The OsMA indicator provides trading signals based on crossovers, divergences, and overbought/oversold levels.
Zero Line Crossovers
When the OsMA line crosses above zero, it indicates upside momentum is strengthening and could be a buy signal. When it crosses below zero, downside momentum is strengthening and could trigger a sell signal.
Divergences
A bullish divergence forms when price makes a lower low while the OsMA forms a higher low. This suggests upside momentum is building despite the price drop, and a reversal up may be near.
A bearish divergence forms when price makes a higher high but the OsMA forms a lower high. This suggests downside momentum is building and could lead to a reversal down.
Overbought/Oversold
Readings above +100 indicate an overbought condition where a reversal down may be imminent. Readings below -100 indicate an oversold condition and a reversal up could occur.
Trading Strategies Using the OsMA Indicator
Here are some trading strategies that utilize the OsMA:
Trend Following
- Go long when the OsMA crosses above zero in an uptrend. Exit when it crosses back below zero.
- Go short when the OsMA crosses below zero in a downtrend. Exit when it crosses back above zero.
Mean Reversion
- Buy when the OsMA is oversold below -100 and turns up. Sell when it becomes overbought above +100 and turns down.
- Fade the crossovers by selling above +100 and buying below -100.
Breakouts
- Buy breakouts on upside crosses of resistance when OsMA is positive. Sell breakouts on downside crosses of support when OsMA is negative.
- Buy bullish divergences near support. Sell bearish divergences near resistance.
Filtering
Use OsMA to filter out false breakout signals when it disagrees with price action. For example, only buy upside breakouts if the OsMA is positive.
Advantages of the Moving Average of Oscillator
Here are some benefits of using the OsMA indicator:
- Clearly visualizes momentum divergences and overbought/oversold levels
- Oscillates clearly around a centerline making it easy to identify crossovers
- Leads MACD crossover signals so can provide earlier warning of trend changes
- Easy to interpret with just one line instead of MACD’s three lines
- Can be used on any time frame from very short-term scalping to long-term position trading
- Works well for confirming price action signals like chart patterns and candlesticks
- Simple and intuitive indicator that is easy to incorporate into trading strategies
Disadvantages of the Moving Average of Oscillator
Some drawbacks of the OsMA indicator include:
- Like MACD, it is a lagging indicator that may signal after much of price movement has occurred
- Can stay overbought or oversold for extended periods during strong trends
- Prone to whipsaws and false signals, especially in choppy or ranging markets
- Divergences don’t always lead to expected price reversals
- Not useful as standalone system, should be combined with other indicators/analysis
- Standard parameters may need optimization for different instruments and time frames
Forex Moving Average of Oscillator OsMA Indicator Conclusion
The Moving Average of Oscillator is a useful technical analysis tool that visualizes the relationship between an oscillator and its signal line. When combined properly with other indicators and price action analysis, the OsMA can aid traders in confirming trend direction, identifying divergences and overbought/oversold levels, and improving timing of entries and exits. However, like all indicators, it should not be relied on exclusively and works best when integrated as part of a complete trading plan. With its advantages and limitations in mind, the OsMA can serve as a valuable addition to a forex trader’s toolbox.

