Forex Multi Meter Version Two Indicator
Forex Multi Meter Version Two Indicator:
FX Multi-Meter II
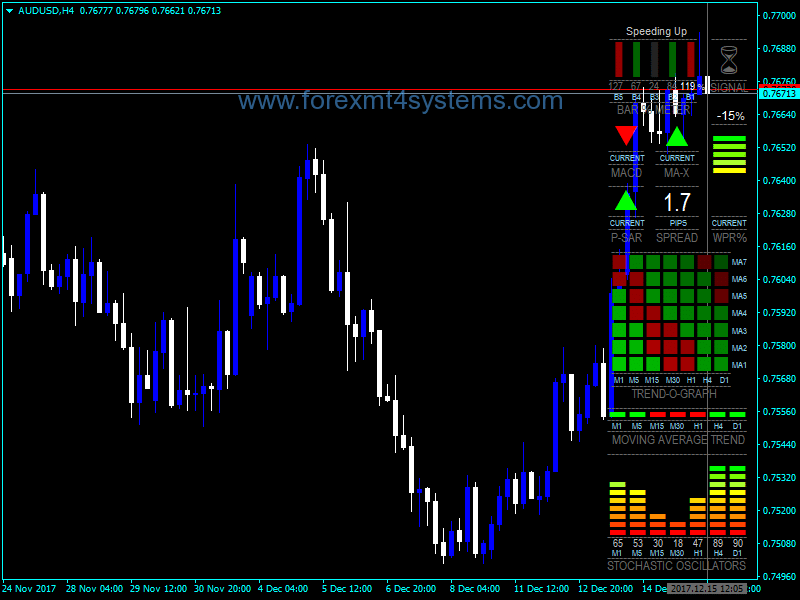
An all-in-one indicator that was inspired by !x-meter. It provides at a glance alot of information that would normally require many charts and indicators and general screen clutter. It was designed to give more precision to both trade entries and exits and provide an instant snapshot of a currency pair’s movement. Multi-Meter works on any currency or timeframe and displays the following…
——————————————————————–
Standard Indicators
- A graph of Stochastic Oscillators on timeframes M1 up to D1.
- An indication of the market trend using Moving Averages on timeframes M1 to D1.
- The direction of the MACD on the current chart, and crossing of the signal line and zero line.
- The direction of a fast 3 period LWMA crossing a 5 period SMA (periods customizable).
- The direction of the Parabolic SAR on the current chart for giving the exit signal and also confirmation for entry.
- An oscillating graph of the William’s % Range indicator. This was used because of its fast movement and unique predictive quality.
Also because its very good for identifying Overbought/Oversold conditions. - A Bar % Increase/Decrease meter developed to give a direct visual representation of the percentage rise or fall of the current price
compared to the last 4 bars. It’s simple but effective. The gist of it is that the previous 4 bar movements (close to close) are averaged
and percentaged, so if the current bar rises above 100% it is speeding up above the recent average, conversely if it drops below 100%
it is slowing down and taking on a more steady movement. Strong price movements are displayed in bright red or green, with varying
shades according to the strength of movement. - The overall recommended signal to trade, based on the various indicator signals.
- And last but not least the spread of the currency, in big easy-to-see numbers.
—————————————————————————————————–
New in Version 2
- A History viewer in the form of a vertical line that can be dragged over previous bars to bring up the history in Multi-Meter. (Beta version)
- A multi-timeframe Trend Graph showing the direction of 7 customizable Moving Averages on 7 timeframes.
- An OB/OS Signal Map, showing the Overbought or Oversold signals from 7 different oscillators/indicators on 7 timeframes.
- Customizable Overall Signal, using a combination of current and multi-timeframe indicator signals.
- Price/Chart/Currency display that can be switched on or off.
- Switch between Default and Compact mode.
- Options can now be accessed without reloading onto a chart.
| Options
======== NOTE: To access the Options (Inputs) for Multi-Meter without reloading it, change to the Monthly timeframe and press F7. By default Multi-Meter has been disabled on the Monthly timeframe for this purpose because the code runs an infinite loop which does not normally allow the access of Options from a chart display. To counteract this the loop must be broken temporarily, in this case the Monthly chart has been set to break the loop and Multi-Meter will not function on this chart by default, but this setting can be changed in the Options panel. HISTORY LINE – Enables or disables the History Line. When Multi-Meter is first loaded onto chart you will see the History Line appear slightly ahead of the current time. Double click on it and drag it across the previous bars to bring up the previous indicator values in Multi-Meter. You can delete the line at any time, but changing timeframes will make a new one appear (only if one is not present). As long as the Histroy Line is ahead of the current price the current readings will be given, so if you’re not using it its best to delete it until you need it again, otherwise it will soon fall behind current time. It is still not perfect and misses bars past the weekend mark, but is quite accurate for short term history. It is more accurate reading the current indicators than the multi-timeframe indicators. COMPACT MODE – Switches from the default full display to a smaller display that resembles Multi-Meter v.1. The Trend Graph or the OB/OS Signal Map are not available in compact mode. DISPLAY PRICE/CHART/CURRENCY – The Price/Chart/Currency display can be turned on or off, font size and colour are customizable. USE MONTHLY CHART FOR OPTIONS – DisableMonthly disables Multi-Meter on the Monthly chart so that Options can be accessed by pressing F7, or from the Expert Advisors menu. PROCESSING LATENCY (SLEEP) – This is the value in milliseconds that the program loop is stopped before restarting the cycle. Default is 100. It can be adjusted for optimizing the Meter to your computer. You can reduce the value for slightly more responsiveness of Multi-Meter but go too low and it will start flickering. TREND-O-GRAPH – This graph shows trend waves of the short and longer term trend. Use DisplayTrendGraph to toggle between the Trend Graph and OB/OS Signal Map. The Trend Graph is displayed by default. The values for the 7 Moving Averages can be set here including the MA Type (Simple, Exponential, Smoothed or Linear Weighted). Default is Smoothed. OVERALL SIGNAL – The overall Signal can be configured to include or exclude the direction of most of the indicators displayed. Current indicators are from the current chart and Multi-timeframe indicators are the MAs from the Trend Bar. Choose which of these signals you want to include or exclude. By default ALL Current indicators and NO Multi indicators determine the signal. OB/OS SIGNAL MAP – This graph displays 7 indicators plotted along 7 timeframes. All of them except Bollinger Bands are Oscillators, and are commonly used for identifying Overbought/Oversold conditions. The indicators are from bottom to top: MACD, Stochastic Oscillator, William’s % Range, Money Flow Index, Commodity Channel Index, Relative Strength Index and Bollinger Bands. If the price moves into an OB or OS zone a grey cross will appear indicating a reversal is imminent. When the the price does reverse the cross will become Green for Buy or Red for Sell. The more crosses the better if you a trading a reversal, as the OB or OS level is more significant. The zone values are customizable, the default values are the most commonly used. The OB/OS Signal Map should be used when the market is ranging sideways, as Oscillators are not very reliable in strong trends. NOTE: The MACD Buy or Sell signal is the MACD crossing the signal line, a grey cross appears if the MACD is falling above the signal line, or rising below the signal line. The Bollinger Bands give a grey signal if the price has moved outside of the bands, if the price reverses the Buy or Sell signal is displayed. INDICATOR VALUES – Values here are for changing the MA-Xover signal, MACD signal, Parabolic SAR signal, MA Trend Bar, W%R and Stochastics. |
|
Reversal Trade setup |
Interpretation of the Signals
As Multi-Meter is a direct display of various indicators, the principles of each should be reviewed to get a good idea of how to interpret them. The Bar % Meter is similar to the Rate Of Change indicator. Overall Signal in the top right corner can be set with different basic conditions. A few minutes with the History Line should show you more than I need explain here but a basic approach to reading the Meter is as follows…
A simpler approach might be… if everything is Green, BUY, if everything is Red, SELL. Example interpretation for Reversal Trade setup. – OB/OS signal Map indicates an extremely Oversold condition on M1 to H1 charts. Recommends BUY. – Bar % Meter is showing that the strong bearish price movement is slowing down and beginning to move up. – MACD is heading downwards. – MA-X is showing that the fast moving 3-period Linear Weighted MA is below the slower 5-period Simple MA. – P-SAR is still travelling downwards and hasn’t swung around yet. The trend is not yet broken. – WPR% is in Oversold territory. – All MA’s except D1 timeframe are trending downwards. – Stochastic Oscillator on 5 timeframes are at rock bottom, indicating an extremely Oversold price condition. – Current spread is 0.8 pips. Nice! – Overall Signal = Wait (before confirmation to Buy) |
What does Forex Indicator mean?
A forex indicator is a statistical tool that currency traders use to make judgements about the direction of a currency pair’s price action. Forex indicators come in many types, including leading indicators, lagging indicators, confirming indicators and so on. Popular forex indicators include moving averages, relative strength index (RSI) and average true range (ATR). A forex trader must choose the indicators that fit his or her trading strategy.
How to install Forex Multi Meter Version Two Indicator?
- Download Forex Multi Meter Version Two Indicator.zip
- Copy mq4 and ex4 files to your Metatrader Directory / experts / indicators /
- Copy tpl file (Template) to your Metatrader Directory / templates /
- Start or restart your Metatrader Client
- Select Chart and Timeframe where you want to test your forex indicator
- Load indicator on your chart
How to uninstall Forex Multi Meter Version Two Indicator?
To shut down an indicator, one has to remove it from the chart. At that, its drawing and recalculation of its values will stop. To remove an indicator from the chart, one has to execute its context menu commands of “Delete Indicator” or “Delete Indicator Window”, or the chart context menu command of “Indicators List – Delete”.

