Forex Past Regression Deviated Method Trading System
Forex Past Regression Deviated Method Trading System:
The past regression deviated method is a strategy that evolved from the Jaimo Method or Hoover Method by Robert L. Royce. That method used a regression channel, EMA 5/8 Cross and MACD. I have modified the method by using past regression deviated, CCI and Stochastics. The basic idea is that when price is far from the central regression line it tends to return. You can think of the red lines as very overbought/oversold levels. This is similar to other oscillating indicators like Stochastics , RSI and CCI when using hook from extreme.
Even though this is a work in progress it has been very successful on the GBPJPY one hour timeframe for the past year. The rules are easy to follow and only require a few indicators. By adjusting the standard deviation settings the method should work well on any pair.
Indicators
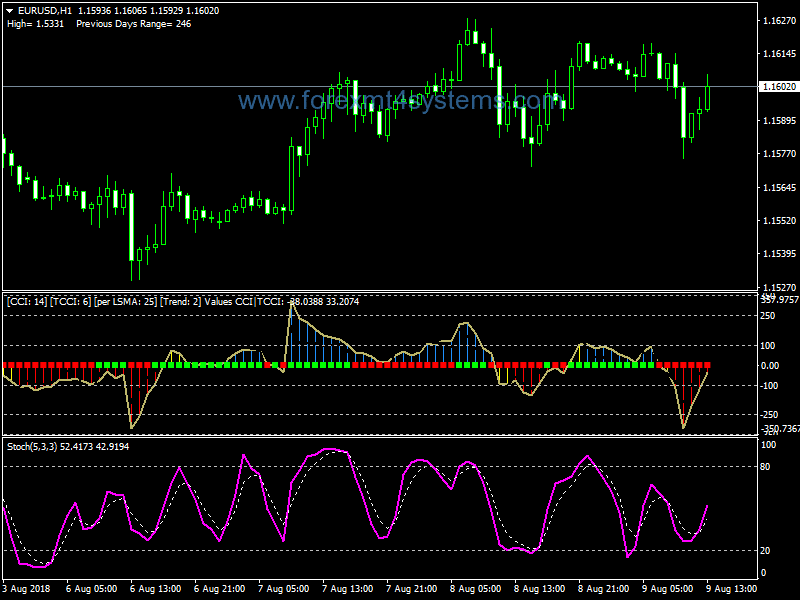
Past regression deviated – Plots the end point of the regression channel as lines.
CCI_Woodies_Lnx_v1_1 – Stochastics
When I first began using this method in May of 2008 I only used the past regression deviated indicator with default settings for entry and CCI_Woodies_Lnx_v1_1 (14, 6 , 25) for confirmation. I use Stochastics (5, 3, 3) for confirmation of exit.
Rules
BUY Entry
When a candle closes between the lower red line and lower orange line on the past regression deviated indicator wait for a close above the lower orange line. At this point the CCI is usually crossing the -100 line from below as a confirmation of the buy signal.
SELL Entry
When a candle closes between the upper red line and upper orange line on the past regression deviated indicator wait for a close below the upper orange line. At this point the CCI is usually crossing the 100 line from above as a confirmation of the sell signal.
Buy/Sell Exit
My rule for exit was very simple. If a Sell signal occurs then exit any open Buy positions. If a Buy signal occurs then exit any open Sell positions.
Scalping
It is also possible to use the past regression deviated as a scalping tool. When the price hits the upper red line place a sell trade. When the price hits the bottom red line place a buy trade. I have not tested this but even on the 1 hr chart there are many trades that result is small wins. It also allows for a better entry when the scalp signal is confirmed by a trade signal crossing the orange line. It would also be interesting to try scalping on lower timeframes. It might be necessary to adjust the Standard Deviation settings to better fit a currency pair.
Money Management
There are several approaches to this method.
You can place a single trade and only exit at a reverse signal or when stop loss is hit. The first stop loss is set at the red line above the entry for buy and below the entry for sell. I try to use a minimum stop loss around 90 pips for this pair. The stop loss is moved as the trade progresses. This has worked well for me in the past but my new approach allows for applying new strategies for exiting of trades with no risk.
In forex a trading strategy is a fixed plan that is designed to achieve a profitable return by going long or short in markets. The main reasons that a properly researched trading strategy helps are its verifiability, quantifiability, consistency, and objectivity.
For every trading strategy one needs to define assets to trade, entry/exit points and money management rules.
How to install Forex Past Regression Deviated Method Trading System?
- Download Forex Past Regression Deviated Method Trading System.zip
- Copy mq4 and ex4 files to your Metatrader Directory / experts / indicators /
- Copy tpl file (Template) to your Metatrader Directory / templates /
- Start or restart your Metatrader Client
- Select Chart and Timeframe where you want to test your forex strategy
- Load indicator on your chart
How to uninstall Forex Past Regression Deviated Method Trading System?
To shut down an indicator, one has to remove it from the chart. At that, its drawing and recalculation of its values will stop. To remove an indicator from the chart, one has to execute its context menu commands of “Delete Indicator” or “Delete Indicator Window”, or the chart context menu command of “Indicators List – Delete”.