Forex Range Action Verification Index Indicator: A Comprehensive Review
The Forex Range Action Verification Index (RAVI) is a popular technical indicator used by traders to determine trend strength and spot potential reversals. This comprehensive review will provide an in-depth look at how the RAVI indicator works, its key features and settings, how to interpret signals, and tips for effective usage in trading strategies.
Download Free Forex Range Action Verification Index Indicator
How the RAVI Indicator Works
The RAVI indicator was developed by Tushar Chande to identify trends and determine whether the market is trending or ranging. It calculates the difference between two moving averages as a percentage.
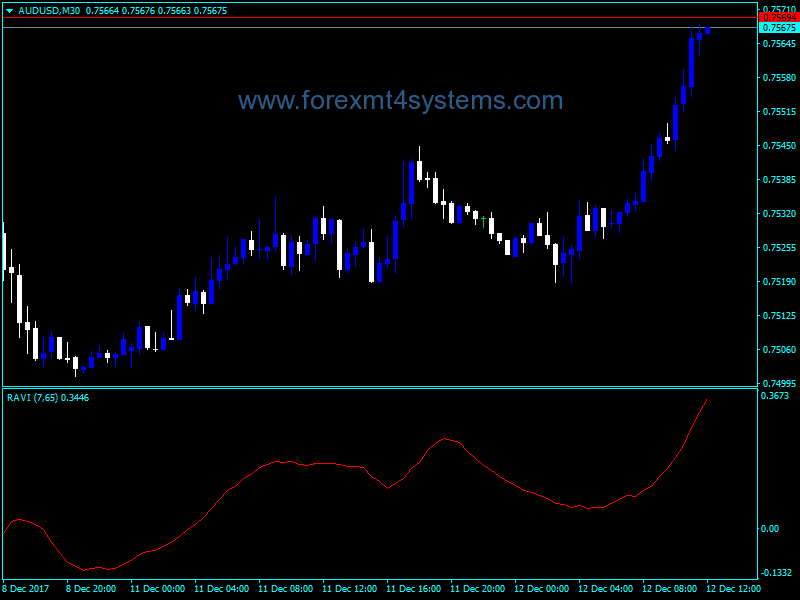
The standard settings compare a short 7 period moving average with a longer 65 period moving average. The percentage difference between the two moving averages is the RAVI value.
Positive RAVI values indicate an uptrend, while negative values signal a downtrend. RAVI values near zero suggest a ranging, non-trending market.
The key to RAVI is that it measures the convergence and divergence of two moving averages. As the shorter moving average pulls away from the longer moving average, the trend is gaining strength. As the two moving averages move closer together, the trend is weakening.
RAVI Formula
The RAVI formula is calculated as follows[5]:
RAVI = (Short MA - Long MA) / Long MA x 100
Where:
- Short MA = Shorter moving average (typically 7 periods)
- Long MA = Longer moving average (typically 65 periods)
This percentage difference between the moving averages is plotted as a histogram oscillating above and below a zero line.
Key Features and Settings
The RAVI indicator has two main parameters – the short and long moving average periods. The standard settings are 7 and 65 periods. However, traders can customize these to suit their trading timeframe.
Some guidelines for setting the periods include:
- Daily charts: 7 and 65 periods
- Weekly charts: 10 and 30 periods
- Hourly charts: 14 and 50 periods
In addition to the moving average periods, RAVI also has overbought and oversold threshold levels, commonly set to 1 and -1. Crossing above or below these levels indicates a strong trend.
How to Interpret RAVI Signals
RAVI trading signals to watch for include[9]:
Uptrend
- RAVI crosses above +1 threshold
- RAVI histogram rises while remaining positive
- Price makes higher highs and higher lows
Downtrend
- RAVI crosses below -1 threshold
- RAVI histogram falls while remaining negative
- Price makes lower highs and lower lows
Range
- RAVI oscillates near zero
- RAVI stays between the +1 and -1 thresholds
- Price moves sideways without clear direction
Reversal
- RAVI crosses from positive to negative or vice versa
- RAVI breaks back below +1 after uptrend or above -1 after downtrend
- Price starts making lower highs after uptrend or higher lows after downtrend
RAVI divergences can also generate trade signals. For example, if price is making new highs but RAVI starts falling, it indicates a potential trend reversal.
Using RAVI in Trading Strategies
The RAVI indicator has several applications in trading strategies:
Trend Identification – RAVI helps determine if the market is trending or ranging. Traders can focus on trend following strategies when RAVI signals a strong trend.
Trade Entry and Exit – Threshold crossovers, histogram turns, and divergences can identify potential entry and exit points.
Confirmation – RAVI can confirm price action and other indicators. For example, only taking long trades when both RAVI and price are rising.
Filter – Requiring RAVI to be above +1 or below -1 filters out range bound markets and weaker trends.
When using RAVI, traders should combine it with other analysis like price action, candlestick patterns, and additional indicators to validate signals and increase precision.
Tips for Effective Usage
Here are some tips when using the RAVI indicator:
- Use longer moving average periods for larger timeframes and shorter periods for smaller timeframes.
- Adjust the overbought/oversold thresholds if needed to match the market volatility.
- Look for confirmations from price action and other indicators.
- Be aware of whipsaws and false signals in choppy or ranging markets.
- Consider adding a trend filter to avoid range bound periods.
- Backtest RAVI strategies across different market conditions.
- Combine RAVI with complementary indicators like RSI, MACD, or Bollinger Bands.
The Pros and Cons of RAVI
Pros
- Quickly identifies new trends and reversals
- Confirms the strength and direction of trends
- Simple and easy to interpret
- Versatile for trend and range strategies
- Customizable parameters
Cons
- Lagging indicator that confirms trends after they begin
- Can generate false signals and whipsaws
- Does not indicate trend direction on its own
- Performs poorly in choppy or sideways markets
- Requires tuning parameters and thresholds
Using RAVI with Other Indicators
RAVI works well when combined with complementary indicators that improve signal accuracy and provide additional trade confirmation.
Here are some examples of effective RAVI combinations:
Moving Averages – Plotting moving averages with RAVI helps identify the overall trend direction. A 200 period MA is commonly used for the long term trend.
RSI – The Relative Strength Index measures momentum. Require both RAVI and RSI to confirm signals for higher precision.
MACD – The Moving Average Convergence Divergence indicator also identifies momentum. Use crossover signals from the MACD lines to confirm RAVI MT4 signals.
Bollinger Bands – The upper and lower bands act as dynamic support and resistance. Look for bounces off the bands in the RAVI direction.
ADX – The Average Directional Index quantifies trend strength. Use a rising ADX to filter RAVI signals for strong trend trades only.
Real World Examples
Let’s look at some real trading examples to see how RAVI performs in action:
Uptrend Confirmation
RAVI Uptrend Confirmation
In this EUR/USD chart, RAVI crossed above +1 in late August 2022, signaling the start of an uptrend. As the uptrend gained strength through September, RAVI stayed elevated while the EUR/USD price rose steadily.
Reversal Signal
RAVI Reversal
On this USD/CAD daily chart, RAVI peaked above +2 and started falling while price was still rising in early September 2022. This bearish divergence preceded a reversal as RAVI dropped below zero and the uptrend stalled.
Range Filter
RAVI Range Filter
Here RAVI oscillates between the +1 and -1 thresholds as GBP/JPY trades sideways for most of September 2022. Applying a range filter would have avoided taking trades during this low probability period.
Forex Range Action Verification Index Indicator Conclusion
The RAVI indicator is a versatile technical tool that can improve trading outcomes when utilized properly. By confirming trends, spotting reversals, and filtering range bound markets, RAVI provides high-probability trade signals in a variety of market conditions.
However, like all indicators, RAVI is not perfect. False signals and whipsaws can occur. To overcome these challenges, traders should combine RAVI with other forms of analysis, tune the parameters to match the market, and thoroughly backtest strategies before going live.
Overall, adding the RAVI indicator to a trading system can boost performance when applied with sound trading principles, robust risk management, and proper strategy validation. It remains a valuable trend and reversal signaling tool for forex traders today.

