Forex Reversal Resistance Trading Strategy
Forex Reversal Resistance Trading Strategy;
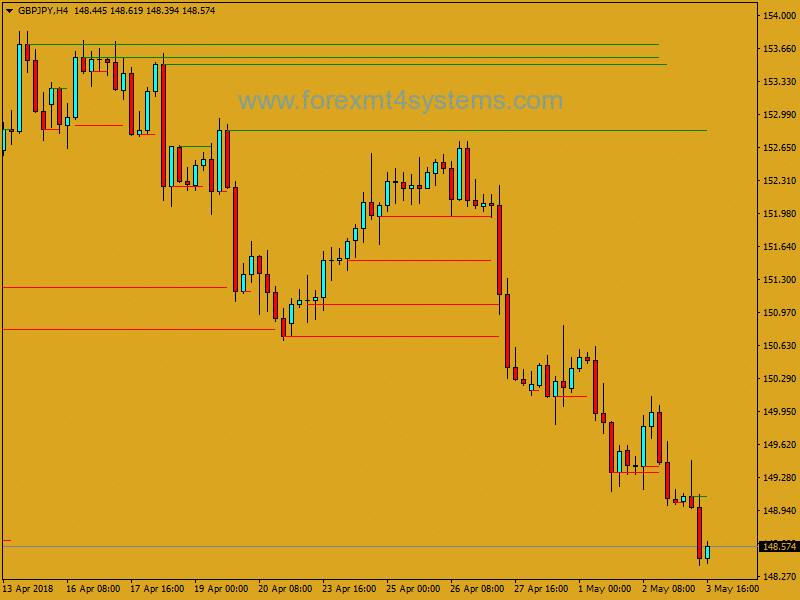
Support and Resistance reversl system is a discretionary strategy pure price action.
Bounce up to the level of price support , buy.
Bounce down to price on the level of resistance , sell.
Time Frame 4H
Time Frame 4H
Markets: Forex, Futures, Indicies.
Trading rules Support and resistance reversal trading system:
Candlestick Closings: Entering a trade is triggered at the close of a candle, when it TOUCHES the resistance or support level as long as the close is no more than 20 pips away from that level and no less than 3 pips. If the price goes up and closes 14 pips below a resistance level (or anywhere in between 3 to 20 pips), then entry will be a sell from the open of the next candle. If the price goes down
towards a support level and closes 4 pips above the support level (or anywhere in between 3 to 20 pips), then entry will be a buy from the open of the next candle.
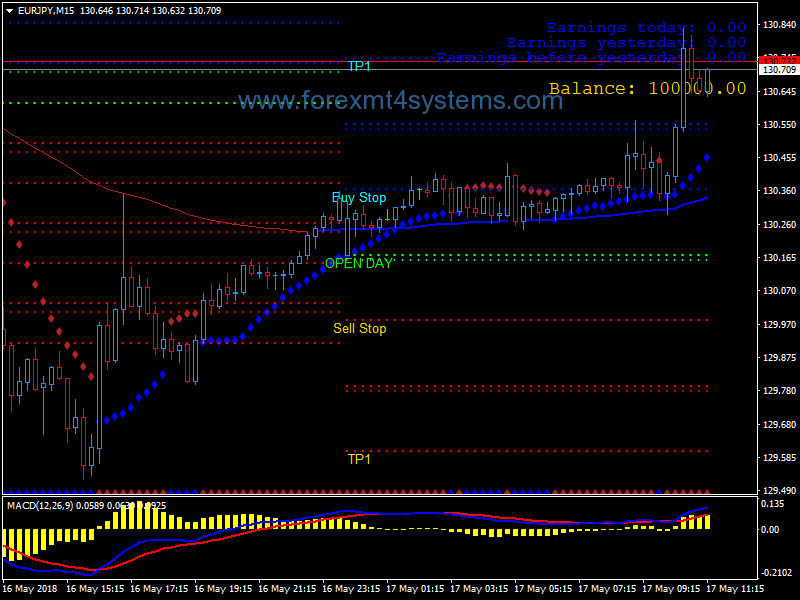
Stochastic Indicator: Once the conditions on the Candlestick closing are met, you MUST look at the stochastic indicator with 5,3,3 settings (especially when you first start using the system, this is all setup automatically when you install the system). The Stochastic needs to be above the 80 line territory or has touched it when selling and below the 20 line territory or has touched it when buying.
Look for either the stochastic red line or blue line to touch either the 80 or 20 line value. Touching the 80 or 20 lines can’t be credited for until the current candle actually close. You will find on many occasions that the 80 or 20 lines get touched, but then retreats back once the current candle reverses.
The Stochastic crosses down when the blue line goes below the red line, and crosses up when the red line goes above the blue line.
Crossing down or up is not necessary, but can decrease the trade risk.
Do not enter a buy position if the next resistance level is less than 50 pips
away, and do not sell if the next support level is less than 50 pips away from the resistance level where conditions were met. You MUST disregard the level if you see that the price has not been respecting it recently and closes below/above that level and then closes back above/below it. Disrespected levels are
kept on your chart so that you consider them if you are already in a buy/sell trade, but never actually enter from these levels.
If you see a line-up of entry conditions, but the level has not been respected before, then entry is NOT valid. Just keep in mind that we don’t care about how the price has been respecting that level in the past 30 days or so. All we need to look at is the previous one to two days (or whenever the last test was). If you actually see the price not respecting the level in the past tests and it just started respecting
the level in the last test, then that level is good to go, and we can enter as soon as the trade conditions line up.
Again, obviously we don’t need to look at how the price has respected the support/resistance level if that level is clean and has not been touched recently.
In forex a trading strategy is a fixed plan that is designed to achieve a profitable return by going long or short in markets. The main reasons that a properly researched trading strategy helps are its verifiability, quantifiability, consistency, and objectivity.
For every trading strategy one needs to define assets to trade, entry/exit points and money management rules.
How to install Forex Reversal Resistance Trading Strategy?
- Download Forex Reversal Resistance Trading Strategy.zip
- Copy mq4 and ex4 files to your Metatrader Directory / experts / indicators /
- Copy tpl file (Template) to your Metatrader Directory / templates /
- Start or restart your Metatrader Client
- Select Chart and Timeframe where you want to test your forex strategy
- Load indicator on your chart
How to uninstall Forex Reversal Resistance Trading Strategy?
To shut down an indicator, one has to remove it from the chart. At that, its drawing and recalculation of its values will stop. To remove an indicator from the chart, one has to execute its context menu commands of “Delete Indicator” or “Delete Indicator Window”, or the chart context menu command of “Indicators List – Delete”.
Download Free Forex Reversal Resistance Trading Strategy
Related Posts
Forex Level Intraday Support Resistance Trading Strategy
Forex Murrey Math Reversal Support Resistance Trading Strategy
Forex Supply Demand Index Support Resistance Trading Strategy