Forex Stochastic MTF Scalping Strategy
Forex Stochastic MTF Scalping Strategy:
Time Frame 15min
Currency pairs:any
1. clock-Indicator BE shows the time remaining before the opening of the next bar.
2. the indicator Stochastic Crossing (14, 5, 5, 3, 1) – shows the intersection of lines of Stochastic Oscillator in the chart price.
3. Indicator Pivots Daily1-finds the Pivot levels that you can use as a possible exit point.
4. Indicator Sessions – has the opportunity to show the best shopping areas.
5. Indicator MarketPrice-W1-displays the price, uses an average price spread, and the number of points from the opening price.
6. Indicator (HMA – a trend indicator.
7.Stochastic Oscillator (14, 5, 5), apply the Linear weighted is used to find the entry point, together with Williams ’ Percent Rage –.
8. Indicator Williams ’ Percent Rage (9) – set in one window (1) with the Stochastic Oscillator (14, 5, 5).
9. MTF Stochastic v 2.0 Alert (9, 5, 5, 3, 1) to M30, Window 2 – define the trend to M30.
10. MTF Stochastic v 2.0 Alert (9, 5, 5, 3, 1) at T2, Window 3-define the trend on H1.
11. MTF Stochastic v 2.0 Alert (9, 5, 5, 3, 1) to H4, Window 3-define trend at H4.
Here are the rules to enter short in the market:
1. Wait for the M15 Stoch Crossing signal (indicated by a fractal symbol, this is just a symbol and not a fractal indicator). You can see that it is in dark orange color and
pointing down.
2. The HMA4 must be in the same direction as the Stoch Crossing above it. It becomes crimson in color.
3. There must be a minimum of 3 (three) MTF Stochastic Oscillators, the M15 along
with any two of the M30, H1 and H4 time frames, in the same direction with point 1.
4. The Williams’ Percent Range Indicator must be close to and above the -90 line. If it is below the -90 line, wait for it to close above the -90 line.
5. If all conditions above are met, then enter the trade at the closing price of the
current bar or the opening price of the next bar.
6. Place the stop loss 40 pips away from the entry price.
7. I place a take profit sometimes, usually when I can’t monitor the price movement
(when I need to leave the monitor). I use the daily pivot support/resistance level to
determine this level.
8. Exit the trade if the WPR comes to the overbought area which is below -90.
9. Exit the trade if the M15 Stochastic has crossed into the oversold area (below -90
level) and ready to cross back up.
10. Exit at the Pivot daily support/resistance line.
Are there any exceptions to the rules above?
The only exception is on the Williams’ Percent Range. At times when the price moves fast, the WPR will be slightly below -90, and this situation is acceptable in the setup that is generated.
This image shows two sell trades starting at the red vertical lines that I have placed on the chart. In both entries, you can see the M15 Stoch Crossing signal (in dark orange) indicate a downward direction. The HMA4 (crimson) is also in the downward direction in both instances, just like the Stoch Crossing above it.
Also, 3 MTF Stochastic Oscillators have crossed and showed a down trend. You can see that these are on the M15, M30 and the H4 time frames.
In both sell entries, you will notice that the Williams’ Percent Range Indicator (WPR) is right above the -90 line. When the WPR dipped below the -90 line, I had to wait for it to go back above the -90 line.
Given the above setup conditions, I entered at the opening price of the next bar. I placed the stop loss 40 pips above the entry price. Later on, I exited the trades as soon as the WPR and the M15 Stochastic came to the oversold zone (below -90).
These are the rules to enter a buy trade:
1. Wait for the M15 Stoch Crossing signal (indicated by a fractal symbol, this is just a
symbol and not a fractal indicator). You can see that it is in lime color and pointing
up.
2. The HMA4 must be in the same direction as the Stoch Crossing below it. It becomes dodgerblue in color.
3. There must be a minimum of 3 (three) MTF Stochastic Oscillators, the M15 along
In forex a trading strategy is a fixed plan that is designed to achieve a profitable return by going long or short in markets. The main reasons that a properly researched trading strategy helps are its verifiability, quantifiability, consistency, and objectivity.
For every trading strategy one needs to define assets to trade, entry/exit points and money management rules.
with any two of the M30, H1 and H4 time frames, in the same direction with point 1.
4. The Williams’ Percent Range Indicator must be close to and below the -10 line. If it is above the -10 line, wait for it to close below the -10 line.
5. If all conditions above are met, then enter the trade at the closing price of the
current bar or the opening price of the next bar.
6. Place the stop loss 40 pips away from the entry price.
7. I place a take profit sometimes, usually when I can’t monitor the price movement
(when I need to leave the monitor). I use the daily pivot support/resistance line to
determine this level.
8. Exit the trade if the WPR comes to the “overbought” zone which is above the -10
level.
9. Exit the trade if the M15 Stochastic has crossed into the overbought area (above the
-10 level) and ready to cross back down.
10. Exit at the Pivot daily support/resistance line.
Are there any exceptions to the rules above?
The only exception is on the Williams’ Percent Range. At times when the price moves fast,
the WPR will be slightly above -10, but this is acceptable in the setup that is generated
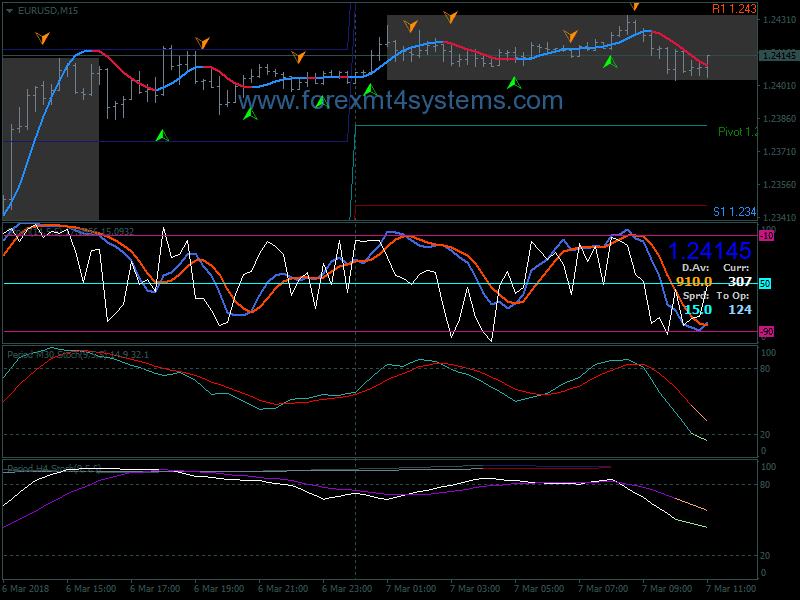
The image above shows two buy trade examples. Here, you can see that just before or along the red vertical lines, the M15 Stoch Crossing signal is pointing upward and in lime color. The HMA4 is also in the same direction as the Stoch Crossing below it and is now dodgerblue in color. The minimum of 3 (three) MTF Stochastic Oscillators have crossed and indicate an upward trend. Here, you’ll notice that they are in the M15, M30, and H4 time frames.
The Williams’ Percent Range Indicator is below the -10 line in both instances.
I then entered a buy position at the closing price of the bar along the red vertical line since all conditions above have been met.
You do not see the stop loss but it should be placed 40 pips below the entry price.
I exited the trade because the WPR and the M15 Stochastic crossed into the overbought area (above the -10 level).
How to install Forex Stochastic MTF Scalping Strategy?
- Download Forex Stochastic MTF Scalping Strategy.zip
- Copy mq4 and ex4 files to your Metatrader Directory / experts / indicators /
- Copy tpl file (Template) to your Metatrader Directory / templates /
- Start or restart your Metatrader Client
- Select Chart and Timeframe where you want to test your forex strategy
- Load indicator on your chart
How to uninstall Forex Stochastic MTF Scalping Strategy?
To shut down an indicator, one has to remove it from the chart. At that, its drawing and recalculation of its values will stop. To remove an indicator from the chart, one has to execute its context menu commands of “Delete Indicator” or “Delete Indicator Window”, or the chart context menu command of “Indicators List – Delete”.