Forex Stochastic Slope Super Signals Swing Trading Strategy
Forex Stochastic Slope Super Signals Swing Trading Strategy;
Stochastic Slope with super signals channel system is an price action momentum forex strategy.
This tradinf system is for metatrader 4.
Time Frame 30 min , 60 min, 240 min, daily.
Currency pairs: EUR/USD, GBP/USD, USD/CHF,AUD/USD, AUD/JPY, GBP/JPY, USD/NZ;
metals: Gold and silver, Incies: S&P 500 Dax and Nasdaq.
Metatrader indicators:
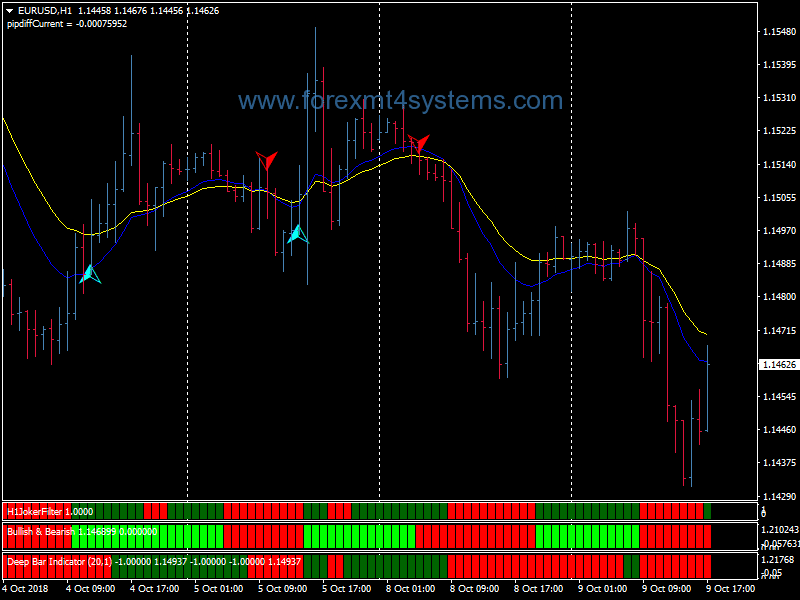
Candle time & Spead indicator,
LSMA in color Indicator,
super signals channel;
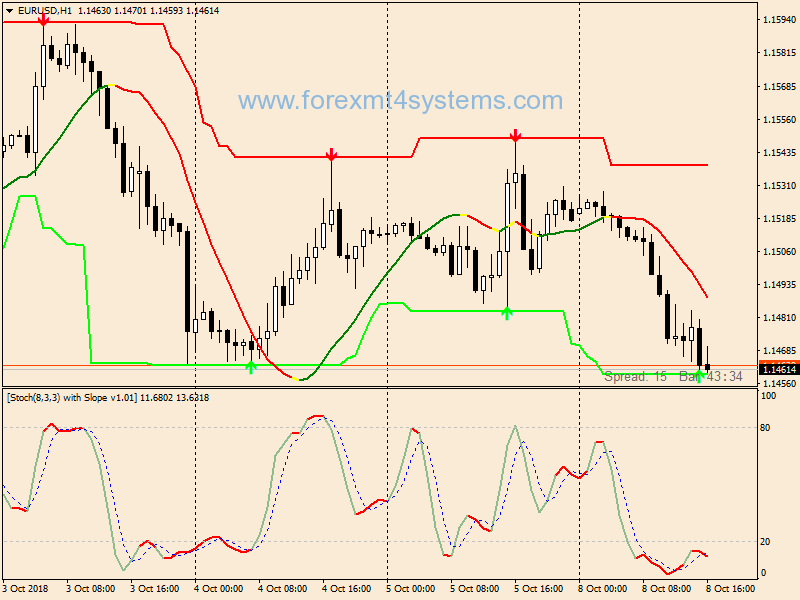
Stochastic slope indicator (8,3,3).
Rules for Stochastic Slope with super signals channel system
Long Entry
Super signals channel green arrow;
LSMA in color Indicator line green color;
Stochastic slope indicator (8,3,3) crossses upward from oversold.
Wait for a candle to close where the conditions 1, 2 and 3 are visible. Place your entry
at the next candle’s open.
Short Entry
Super signals channel red arrow;
LSMA in color Indicator line red color;
Stochastic slope indicator (8,3,3) crossses downward from overbought.
Wait for a candle to close where the conditions 1, 2 and 3 are visible. Place your entry
at the next candle’s open.
In forex a trading strategy is a fixed plan that is designed to achieve a profitable return by going long or short in markets. The main reasons that a properly researched trading strategy helps are its verifiability, quantifiability, consistency, and objectivity.
For every trading strategy one needs to define assets to trade, entry/exit points and money management rules.
How to install Forex Stochastic Slope Super Signals Swing Trading Strategy?
- Download Forex Stochastic Slope Super Signals Swing Trading Strategy.zip
- Copy mq4 and ex4 files to your Metatrader Directory / experts / indicators /
- Copy tpl file (Template) to your Metatrader Directory / templates /
- Start or restart your Metatrader Client
- Select Chart and Timeframe where you want to test your forex strategy
- Load indicator on your chart
How to uninstall Forex Stochastic Slope Super Signals Swing Trading Strategy?
To shut down an indicator, one has to remove it from the chart. At that, its drawing and recalculation of its values will stop. To remove an indicator from the chart, one has to execute its context menu commands of “Delete Indicator” or “Delete Indicator Window”, or the chart context menu command of “Indicators List – Delete”.