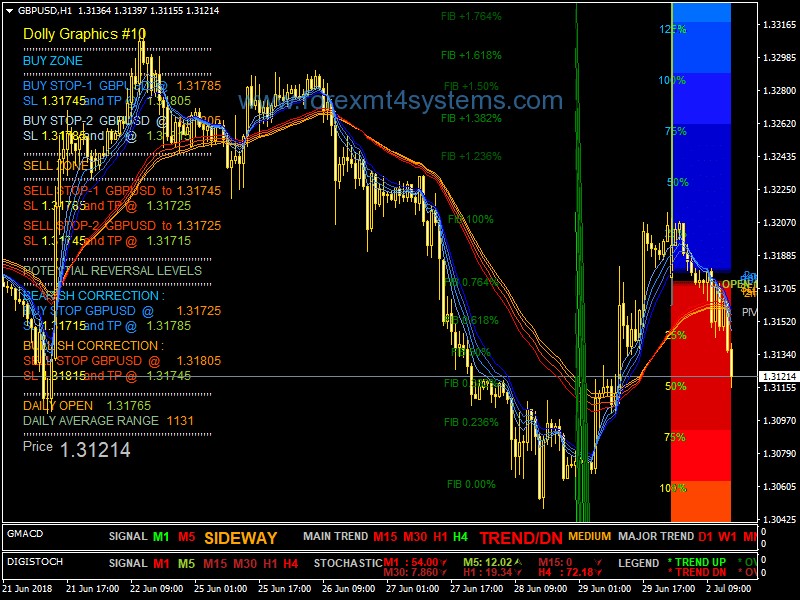
Forex Super Dolly V2 Trading System
Forex Super Dolly V2 Trading System;
Entry & Exit Basic Rules
Buy
1. GMACD – main trend H4 & D1 (for Major Trend) – GREEN color (Up
Trend)
2. Guppy Line – Make sure Blue Line Above Red Line.
3. Place Buy Order
Instant Order : Buy Stop-1 Price OR in Blue Area before Buy Stop-1 TP
Pending Order : Price Buy Stop-1, TP @ Buy Stop-1 TP, SL @ Buy
Stop-1 SL
Sell
1. GMACD – main trend H4 & D1 (for Major Trend) – RED color (Down
Trend)
2. Guppy Line – Make sure Blue Line Below Red Line.
3. Place Sell Order
Instant Order : Sell Stop-1 Price OR in Red Area before Sell Stop-1 TP
Pending Order : Price Sell Stop-1, TP Sell Stop-1 TP, SL Sell
Stop-1 SL
Noise Filter
This filter work for Instant Order.
1. Bollinger Bands (21,2) TF H1
2. Envelopes (21,0.07%) TF H1
3. GMACD2 (8,17,9) TF H1
When price TOUCH or IN SELL/BUY AREA make sure candle below/above
mid bands and outside below/above and not touch envelopes. GMACD2 cross
down/upwards. Make sure previous candle NOT close inside below/above
envelopes. Place orders on next candle.
Dolly 0% & 100% Fibo Lines
PAIR: Any (Please set Fibo_Lines = True)
** This technic will give you 99.9% performance & low risk
To set pending order normally The original strategy is placing stop order above
and below price at open price of daily candle. However, different broker usually
start new daily candle at different time because of GMT differential. This matter
can be solved by changing GMT parameter value at the indicator properties.
Buy
1) Place Buy Stop Fibo 100% + 2 pip + Pair Spread
2) SET TP 5-10 pip or 0.000 (use trailing for better result)
3) SET SL 100% price – 20-30 pip
Sell
1) Place Red Stop Fibo 0% + 2 pip + Pair Spread
2) SET TP 5-10 pip or 0.000 (use trailing for better result)
3) SET SL 0% price + 20-30 pip
Things to consider with G#MACD
1. NEVER Trade against the H1
2. Look for a steep angle and good separation on the lines – the best moves are
when the lines go through the zero level at a steep angle
3. The histogram gives an early warning of direction and strength
4. Look for DIVERGENCE on the higher timeframes
5. If H1 & H4 are turned in the same direction then moves of 120 to 200 plus
are on with the GBP
6. If H1 & H4 are against each other then moves of 80 to 100 pips for the
GBP
7. M15 shows the medium moves
8. M5 and M1 are used to fine tune the entries, wait for the M5 to just turn if
possible confirmed with a slightly previous M1 turn in the same direction
this way even if you are wrong generally you will get out of the trade with a
small loss or a small profit. M5 moves can show anything from 10 pips to 60
pips or more depending on the day.
9. Below the zero level is downward pressure and above the zero level is
upward pressure
10.If the M15 is on the zero level and almost parallel to it usually the H1 is
fairly flat as well this means the market has no real direction DO NOT
TRADE.However the longer this situation continues generally the larger
and more explosive the move when it comes – this is a situation often seen
on the trading day just before NFP is posted.
11.The M15 G#MACD moves back to the zero level after a large move, this
is NEUTRALISATION and not a directional indication or DIVERGENCE
it is merely the indicator resetting – After it reaches the zero level then what
happens is important.
In forex a trading strategy is a fixed plan that is designed to achieve a profitable return by going long or short in markets. The main reasons that a properly researched trading strategy helps are its verifiability, quantifiability, consistency, and objectivity.
For every trading strategy one needs to define assets to trade, entry/exit points and money management rules.
How to install Forex Super Dolly V2 Trading System?
- Download Forex Super Dolly V2 Trading System.zip
- Copy mq4 and ex4 files to your Metatrader Directory / experts / indicators /
- Copy tpl file (Template) to your Metatrader Directory / templates /
- Start or restart your Metatrader Client
- Select Chart and Timeframe where you want to test your forex strategy
- Load indicator on your chart
How to uninstall Forex Super Dolly V2 Trading System?
To shut down an indicator, one has to remove it from the chart. At that, its drawing and recalculation of its values will stop. To remove an indicator from the chart, one has to execute its context menu commands of “Delete Indicator” or “Delete Indicator Window”, or the chart context menu command of “Indicators List – Delete”.