Forex TDI Dashboard Swing Trading Strategy
Forex TDI Dashboard Swing Trading Strategy:
This indicator Have Been written by Dean Malone.
The code of this indicator has been translated to many trading platforms as Tradestion, Nija Trader, FX Station, Metatrader 4 and Metatrader 5.
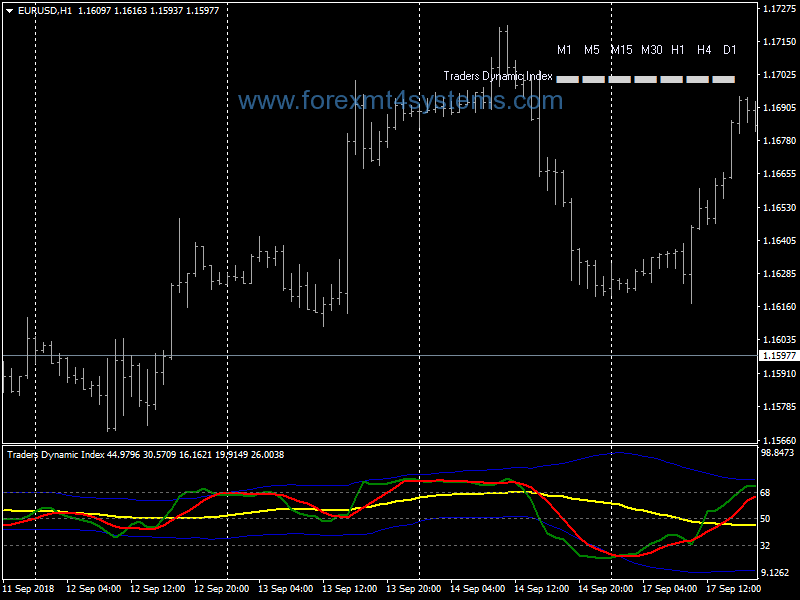
This is an indicator used by many forex traders because it is both an indicator of trend, momentum and can also be used as an indicator of inversion. Therefore, you can define theTraders Dynamic Index , due to its characteristics, a leading indicator.
This indicator uses some of the most powerful indicators such as the RSI as well as other types of calculations to determine the trend and momentum of the pairs. This indicator gives you the current situation of the pair you put it on and let you know whether we are in a bull or bear situation. Although this indicator can be used standalone, it is advised that you use other confirming indicators together with it. The Indicator Parameters are as follows:
Relative Strength Index (Period 13, close) — the period in bars for calculation of RSI indicator. RSI_
Volatility_Band (period, 34) . The lower this value is the curvier becomes the band.
Relative Strength Indexprice Line (period 2) — the period of the first moving average (fast).
Relative Strength Index PriceType (default = MODE SMA) — the type of the first ma.
Trade_Signal Line (period 7) — the period of the second ma (slow).
Trade_Signal Type (default = MODE SMA) — the type of the second moving average.
Use Alerts (default = false) — if true then sound alert will be played each time red and yellow lines cross.
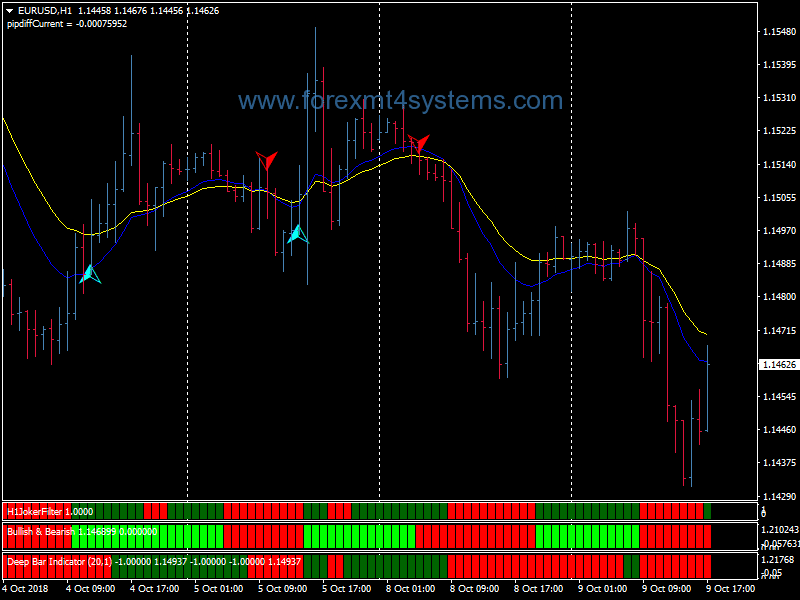
When to Go Long You can open a BUY position when the following happens: 1. Green line is above red line 2. Both Green and Red line are above Yellow line 3. Yellow line is above 50 (Optional for long term/Must for short-term)
When to go Short You can open a SELL position when the following happens: 1. Red line is above Green line 2. Both Red and Green lines are below Yellow line.
3. Yellow line is below 50 (Optional for long term/Must for short-term) When NOT to enter a trade 1. Do not enter a trade when the Green/Red lines are outside the Blue Line or very near to it… try to enter the trades as close to the Yellow line as possible. 2. Do not enter trade when the Blue lines (bands) are too narrow as it shows little volatility in the market.
In forex a trading strategy is a fixed plan that is designed to achieve a profitable return by going long or short in markets. The main reasons that a properly researched trading strategy helps are its verifiability, quantifiability, consistency, and objectivity.
For every trading strategy one needs to define assets to trade, entry/exit points and money management rules.
How to install Forex TDI Dashboard Swing Trading Strategy?
- Download Forex TDI Dashboard Swing Trading Strategy.zip
- Copy mq4 and ex4 files to your Metatrader Directory / experts / indicators /
- Copy tpl file (Template) to your Metatrader Directory / templates /
- Start or restart your Metatrader Client
- Select Chart and Timeframe where you want to test your forex strategy
- Load indicator on your chart
How to uninstall Forex TDI Dashboard Swing Trading Strategy?
To shut down an indicator, one has to remove it from the chart. At that, its drawing and recalculation of its values will stop. To remove an indicator from the chart, one has to execute its context menu commands of “Delete Indicator” or “Delete Indicator Window”, or the chart context menu command of “Indicators List – Delete”.