Forex Three Line Break Indicator
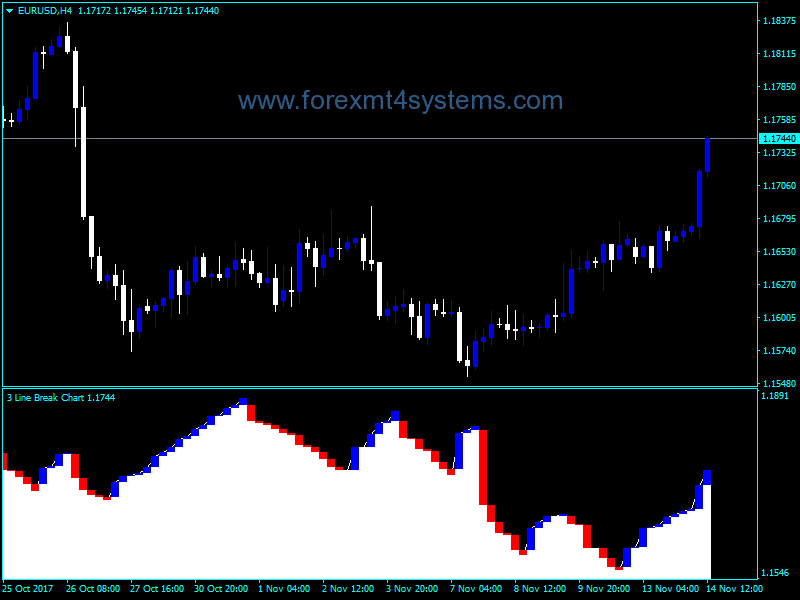
Three-line break charts represent a raw of vertical rectangle, the height of which is determined by the value of price changes. These charts – like Kagi, P&F, Renko – do not consider time factor. This graphical method is named after the number of lines usually used to register a break.
Three-line break charts were first brought to the United States by Steven Nison when he published his book, Beyond Candlesticks.
Basic rules of trading using a three-line break chart are given below:
- Buy when after three consecutive red lines, a blue line appears (“the blue reversal line”).
- Sell when after three consecutive blue lines, a red line appears (“the red reversal line”).
- Do not trade when there is no stable trend, i.e. when blue and red lines alternate.
Advantage of three-line break charts is no reversal criterion set at random. The price dynamics itself denotes the reversal. A disadvantage of such charts can be the appearance of reversal signals after the new trend has been formed. But many traders are ready to have patience and enter the market later in exchange for an opportunity to cover the main part of a large trend.
The reversal signals sensitivity can be varied by changing the amount of lines used to register the break. Thus, traders who practise short-term operations can use a two-line break, which gives more reversal signals. For investors who are interested in long-term outlook, four-line or even ten-ine breaks can be more preferable since they decrease the amount of signals.In Japan, the three-line break is the most commonly used.
S. Nison recommends to use three-line break charts together with candlesticks. Doing so, one is supposed to detect the direction of the main trend using the former method and determine specific points of entrance and quitting the market.
Parameters
LB – count of break lines
What does Forex Indicator mean?
A forex indicator is a statistical tool that currency traders use to make judgements about the direction of a currency pair’s price action. Forex indicators come in many types, including leading indicators, lagging indicators, confirming indicators and so on. Popular forex indicators include moving averages, relative strength index (RSI) and average true range (ATR). A forex trader must choose the indicators that fit his or her trading strategy.
How to install Forex Three Line Break Indicator?
- Download Forex Three Line Break Indicator.zip
- Copy mq4 and ex4 files to your Metatrader Directory / experts / indicators /
- Copy tpl file (Template) to your Metatrader Directory / templates /
- Start or restart your Metatrader Client
- Select Chart and Timeframe where you want to test your forex indicator
- Load indicator on your chart
How to uninstall Forex Three Line Break Indicator?
To shut down an indicator, one has to remove it from the chart. At that, its drawing and recalculation of its values will stop. To remove an indicator from the chart, one has to execute its context menu commands of “Delete Indicator” or “Delete Indicator Window”, or the chart context menu command of “Indicators List – Delete”.

