Forex EJ Cross Signals Swing Trading Strategy
Forex EJ Cross Signals Swing Trading Strategy:
Definition:
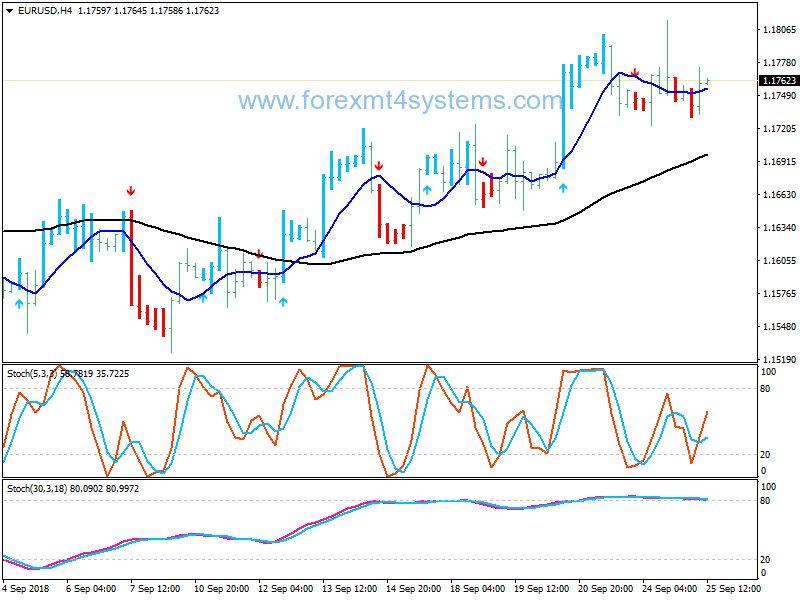
– Use H4 chart.
– Blue candles mean uptrend and red candles mean down trend, green ones (non-colored) means directionless or range market.
– In most of the time changing red or blue color to green one means changing trend possibility.
– White line is 8SMA and yellow one is 55SMA; 8SMA swings and oscillates around 55SMA, they most of the time play the role of resistances especially 55SMA that shows the longer term trend.
When yellow line (55SMA) has a positive slope means the major trend is up and we buy, when
pointing down we go short (sell), the signals for enter long (buy) are:
o Up pointing blue arrow
o Blue candle
o White line has crossed yellow one and pointing upo Yellow line has positive slope or is going to head up Until candles are above the white line it means uptrend still has the momentum to go upper, same goes for down trend, until candles are below the white line it means the downward momentum exists.
Any close below white line means the uptrend is going to over and this is a start for downward move, same goes for uptrend, any close above white line indicates a potential reversing from downside to upside and moving up.
This happens most of time with green candles and the trend reverse with arrow signals and changing the color of candles (from green or blue to red or form green or red to blue)
THE BEST ENTRY:
Most of the time after a sharp (strong trend) breakout or breakdown the price will reverse nicely after reaching top in uptrend or dip in downtrend, this can be recognized by changing slope of white line, changing color of candle and signal arrow, the close at the other side of the white line is a confirmation.
The examples
may be easier to understand:
After a good uptrend (almost 350 pips) price movement stalls and just after the first close below white line the color changes into red and the magenta arrow indicates a sell signal. Two close is better and three is a charm. In these types of entries the stop loss will be about 10 pips above the higher high and the first target will be yellow line. This is the easiest way to put a stop loss, any other way is OK, same goes for taking a target level, for take profit the methods are different and this must be implemented better. The best instruments that can be used to determine a good take profit and exiting time are:
– weekly and monthly pivot points
– Fibonacci resistances/extensions
– 100/200 EMA (Exponential Moving Average)
– Candle patterns especially hammer and spinning top near a moving average or PP (Pivot Point)
– Changing the slope of white line
– Changing the color of candles
– Close at the other side of white line
-Chart patterns especially double/triple top/bottom
It is not important that what implement or how many of them you use, the implementing is important, it means that try to keep it as much as easy you can. The best systems are the simplest. In this type of entry the slope of yellow must not be regarded except when price is getting closer to that, because it may rebound from that and continue its major trend that would be our exit point.
In forex a trading strategy is a fixed plan that is designed to achieve a profitable return by going long or short in markets. The main reasons that a properly researched trading strategy helps are its verifiability, quantifiability, consistency, and objectivity.
For every trading strategy one needs to define assets to trade, entry/exit points and money management rules.
How to install Forex EJ Cross Signals Swing Trading Strategy?
- Download Forex EJ Cross Signals Swing Trading Strategy.zip
- Copy mq4 and ex4 files to your Metatrader Directory / experts / indicators /
- Copy tpl file (Template) to your Metatrader Directory / templates /
- Start or restart your Metatrader Client
- Select Chart and Timeframe where you want to test your forex strategy
- Load indicator on your chart
How to uninstall Forex EJ Cross Signals Swing Trading Strategy?
To shut down an indicator, one has to remove it from the chart. At that, its drawing and recalculation of its values will stop. To remove an indicator from the chart, one has to execute its context menu commands of “Delete Indicator” or “Delete Indicator Window”, or the chart context menu command of “Indicators List – Delete”.