Forex Bollinger Band Stop RSI Filter Trading Strategy
Forex Bollinger Band Stop RSI Filter Trading Strategy:
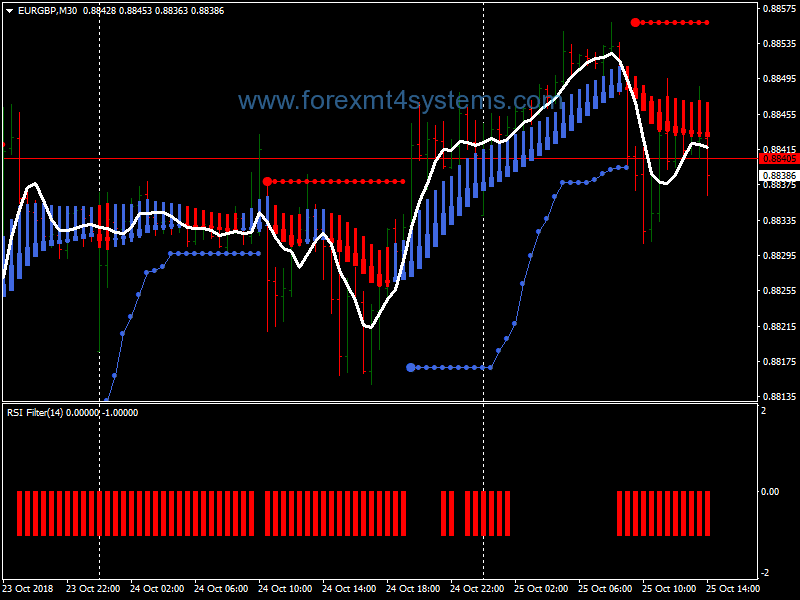
Bollinger Band Stop with RSI Filter is a trend following multi time frame strategy based on the Bollinger Band Stop indicator and RSI Filter.
Time Frame 15 min or higher.
Markets: Currency pairs (majors), Indicies (S&P 500, Nasdaq, Dow Jones, DAX, FTSE) Commodities (Silver, Gold and Oil).
Metatrader Indicators setting:
Bollinger Band Stop (20:2),
RSI Filter (14 period),
HBH bar (1-15),
5 simple moving average (optional)
Trading rules Bollinger Band Stop with RSI Filter
Trade only in direction of the major trend.
If you want trade 4h time frame, open daily chart and check the trend after open the 4H chart and trades in direction of the trend of daily chart.
How you check the trend? Simple:-Bollinger Band Stop and RSI Filter must be agree.
Time frame setting:
15 min time frame with 60 min,
30-60 min time frame with 240 min,
240 min time frame with daily time frame,
daily time frame with weekly time frame.
Best time frame are 240 min (with daily) and daily (with weekly).
Buy
Bollinger Band Stop blue dot,
HBH bar doger blue,
RSI filter blue bar.
In forex a trading strategy is a fixed plan that is designed to achieve a profitable return by going long or short in markets. The main reasons that a properly researched trading strategy helps are its verifiability, quantifiability, consistency, and objectivity.
For every trading strategy one needs to define assets to trade, entry/exit points and money management rules.
How to install Forex Bollinger Band Stop RSI Filter Trading Strategy?
- Download Forex Bollinger Band Stop RSI Filter Trading Strategy.zip
- Copy mq4 and ex4 files to your Metatrader Directory / experts / indicators /
- Copy tpl file (Template) to your Metatrader Directory / templates /
- Start or restart your Metatrader Client
- Select Chart and Timeframe where you want to test your forex strategy
- Load indicator on your chart
How to uninstall Forex Bollinger Band Stop RSI Filter Trading Strategy?
To shut down an indicator, one has to remove it from the chart. At that, its drawing and recalculation of its values will stop. To remove an indicator from the chart, one has to execute its context menu commands of “Delete Indicator” or “Delete Indicator Window”, or the chart context menu command of “Indicators List – Delete”.