Forex High Probability Low Risk Support Resistance Trading Strategy
Forex High Probability Low Risk Support Resistance Trading Strategy;
High Proability Low Risk trading is a system that identifies high probability low risk
profitable trades.
Time frame 5 min or higher.
Currency pairs:any.
Metatatrader indicators
1. SuppRTF
2. Exponential Moving Averages
a. 15 EMA applied to High
b. 15 EMA applied to Low
c. 200 EMA applied to Close
3. MACD (12, 26, 9 applied to Close)
Trading Rules High Probability Low Risk trading
Buy
1. Price and EMA channel are above 200 EMA.
2. Price makes a swing low above the 200 EMA, which means red SR dots must form
above 200 EMA.
2. Price closes above the dodger blue EMA 15 (applied to high).
3. Enter a buy trade if MACD histogram is above the signal line. For additional
confirmation (optional), the MACD histogram is above the zero line as well.
4. Stop loss along the magenta EMA 15 (applied to close).
5. Take profit at 1:1. You have an option to trail your stops instead of, or along with,
placing a hard target. Trail your stop under every new swing low or magenta 15 EMA
line.
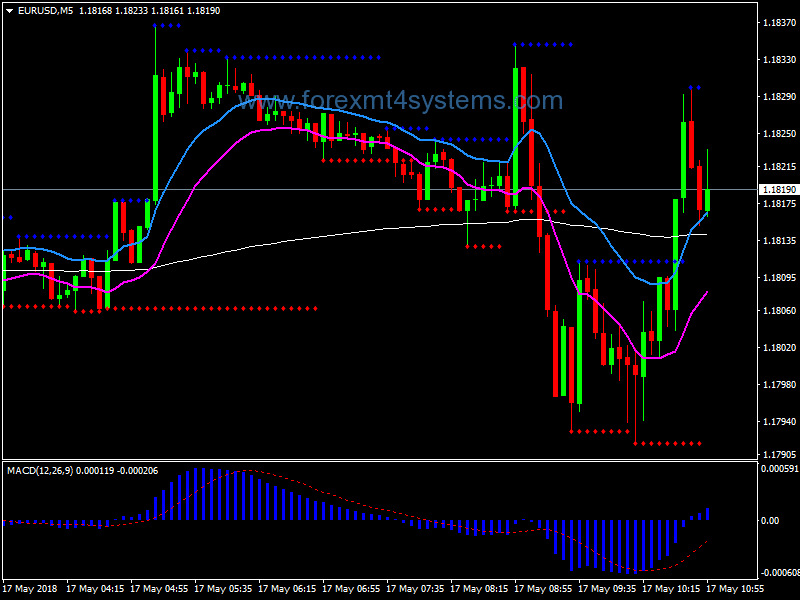
Buy example
The 200 EMA is way below the price and the 15 EMA channel. Price closed above the
upper channel line and the previous SuppRTF level before closing. At this point, the
MACD histogram is above the zero line and crossed above the signal line, so we can
place a buy trade.
Set the stop loss along the lower channel line and the take profit at the same distance as the stop loss. If you have time to monitor the trade, you may trail the stop loss along the magenta line then under every new swing low that formed, based on the newly formed red SuppRTF dots.
Sell
1. Price and EMA channel are under 200 EMA.
2. Price makes a swing high under the 200 EMA, which means blue SR dots must form
under 200 EMA.
2. Price closes under the magenta EMA 15 (applied to close).
3. Enter a sell trade if MACD histogram is under the signal line. For additional
confirmation (optional), the MACD histogram is below the zero line as well.
4. Stop loss along the dodger blue EMA 15 (applied to high).
5. Take profit at 1:1.You have an option to trail your stops instead of, or along with,
placing a hard target. Trail your stop above every new swing high or dodger blue 15
EMA line.
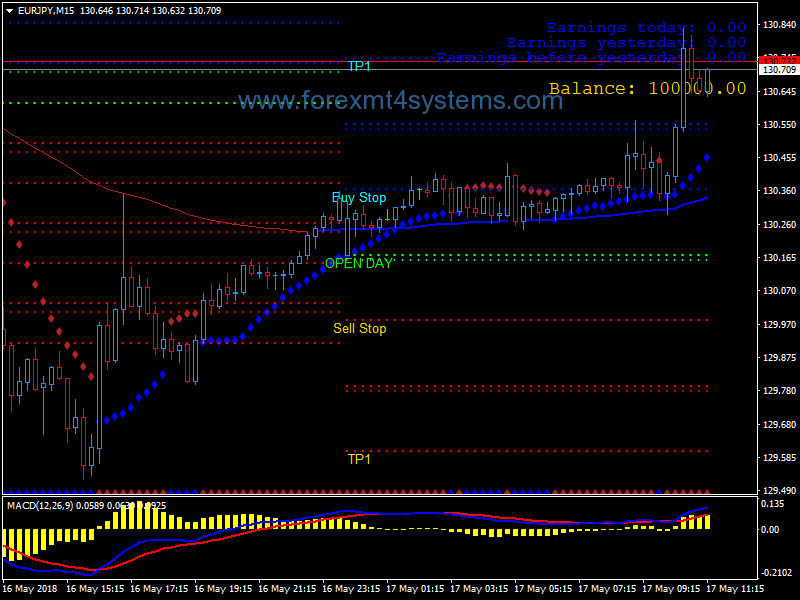
Sell example
Below is a sell trade on the USDCHF 1 hour chart. Price and the 15 EMA channel had
been under the 200 EMA for some time now indicating a down trending market.
Price breaks under the magenta line and the red SuppRTF. At the bottom, we can see
that the MACD histogram is below the zero line and the signal line, so we can place a
sell trade at the close of the candle.
Set the stop loss along the blue channel line and the take profit at 1:1. In less than 30 minutes, price tagged the take profit and the trade was closed.
In forex a trading strategy is a fixed plan that is designed to achieve a profitable return by going long or short in markets. The main reasons that a properly researched trading strategy helps are its verifiability, quantifiability, consistency, and objectivity.
For every trading strategy one needs to define assets to trade, entry/exit points and money management rules.
How to install Forex High Probability Low Risk Support Resistance Trading Strategy?
- Download Forex High Probability Low Risk Support Resistance Trading Strategy.zip
- Copy mq4 and ex4 files to your Metatrader Directory / experts / indicators /
- Copy tpl file (Template) to your Metatrader Directory / templates /
- Start or restart your Metatrader Client
- Select Chart and Timeframe where you want to test your forex strategy
- Load indicator on your chart
How to uninstall Forex High Probability Low Risk Support Resistance Trading Strategy?
To shut down an indicator, one has to remove it from the chart. At that, its drawing and recalculation of its values will stop. To remove an indicator from the chart, one has to execute its context menu commands of “Delete Indicator” or “Delete Indicator Window”, or the chart context menu command of “Indicators List – Delete”.
Download Free Forex High Probability Low Risk Support Resistance Trading Strategy
Related Posts
Forex Level Intraday Support Resistance Trading Strategy
Forex Murrey Math Reversal Support Resistance Trading Strategy
Forex Supply Demand Index Support Resistance Trading Strategy