Forex Snake Wave Swing Trading Strategy
Forex Snake Wave Swing Trading Strategy:
Time Frame 5min or higher (work best 4H yime frame).
Currency pairs:any.
Metatrader Indicators:
Market Price
Price channel Stop,
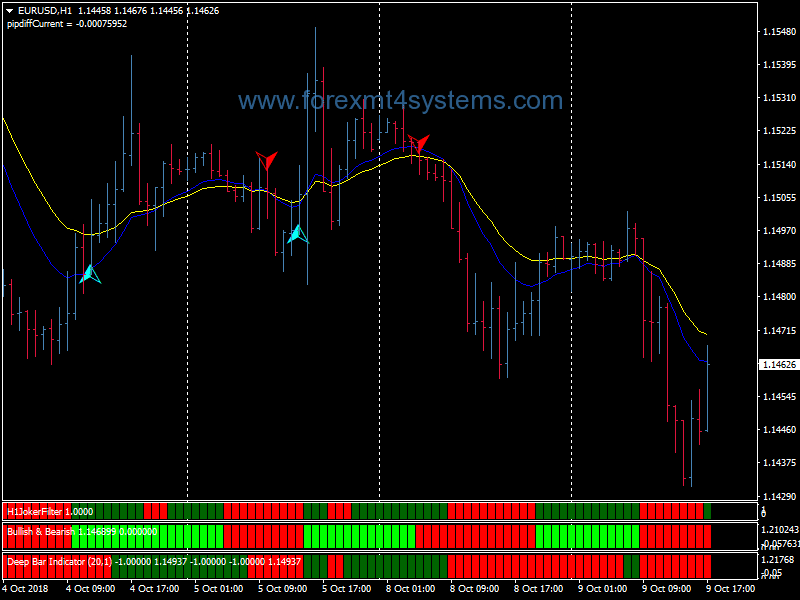
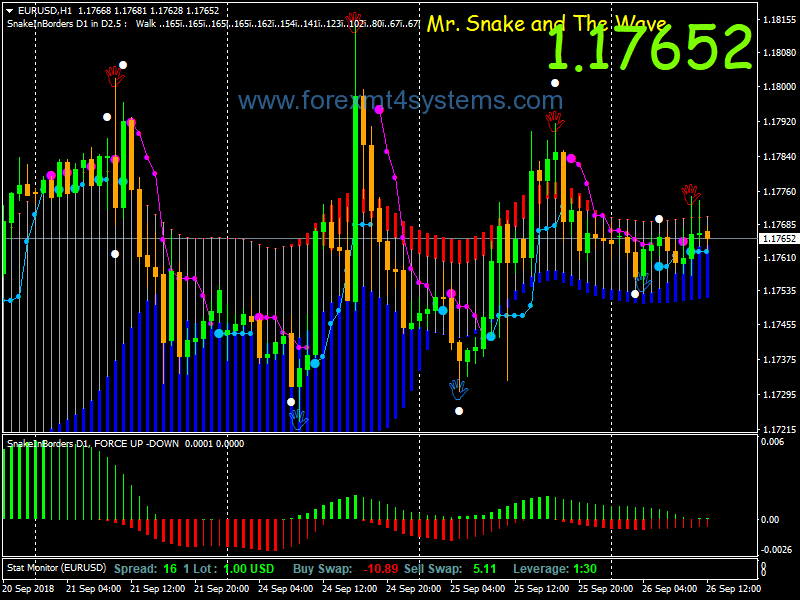
SHI Silver Trend(to show the top or bottom of price movement),
Snake Borders, (In snakeborders, red color indicate pressure of downtrend, blue color indicates pressure of uptrend, silver indicate neutral),
Snake Force(to show the trend, green indicates uptrend, red indicates downtrend),
Status monitor,
TangaJiwa (to show the top or bottom of price movement),
Buy
Prive channel stop blue dot buyl after red chain penetrated by up movement price and show the blue chain below, buy according to the visualization of snake force. Green indicates up trend.
Sell
Sell after blue chain penetrated by down movement price and show the red chain above buy according to the visualization of snake force and red indicates downtrend.
Exit position
1)when appears opposite dot of the prive channel
2)At the Support o resistance levels
3) Profit Target predetermined, depends by time frame and currency, or ratio 1:5 stop loss.
4) Stop loss on the previous swing.
In forex a trading strategy is a fixed plan that is designed to achieve a profitable return by going long or short in markets. The main reasons that a properly researched trading strategy helps are its verifiability, quantifiability, consistency, and objectivity.
For every trading strategy one needs to define assets to trade, entry/exit points and money management rules.
How to install Forex Snake Wave Swing Trading Strategy?
- Download Forex Snake Wave Swing Trading Strategy.zip
- Copy mq4 and ex4 files to your Metatrader Directory / experts / indicators /
- Copy tpl file (Template) to your Metatrader Directory / templates /
- Start or restart your Metatrader Client
- Select Chart and Timeframe where you want to test your forex strategy
- Load indicator on your chart
How to uninstall Forex Snake Wave Swing Trading Strategy?
To shut down an indicator, one has to remove it from the chart. At that, its drawing and recalculation of its values will stop. To remove an indicator from the chart, one has to execute its context menu commands of “Delete Indicator” or “Delete Indicator Window”, or the chart context menu command of “Indicators List – Delete”.