Forex Tunnel Dynamic Index Swing Trading Strategy
Forex Tunnel Dynamic Index Swing Trading Strategy:
Tunnel trading with Traders Dynamic Index is a complex trading system based on the indicators trend-momentum smoothed by SSA normalized and metatrader indicators based on the SSA normalized.
I trade only in direction of the trend but with this trading system (template-s) there are many interpretations.
Time Frame H1 or higher.
Currency pairs: any.
Metatrader Indicators library and templates:
Signal Price,
200 Exponential moving average,
89 exponential moving average (close) with levels (300 and – 300);
Pulse fibonacci Pivot optional for intraday trading;
480 exponential moving average (close);
SSA (0, 20,2, 55);
SSA (0,20, 4, 21);
SSA (0,10,2, 10);
SSA (0, 20, 2 144);
SSA Force oscillator;
Traders Dinamic Index SSA Nomalizrd with alerts.(setting 500 bars)
Library:
Ahp.dll
libSSA.
Templates:
Ass
Ass1
Ass2
Template of this example is AS 1.
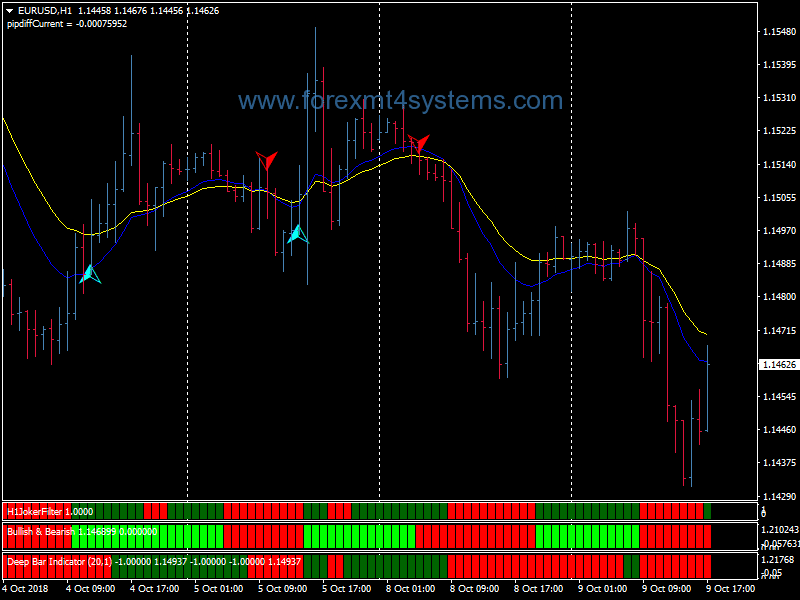
Rules for Tunnel trading with Traders Dynamic Index
Trades only in direction of the trend.
Buy
Price > 89 EMA> 200 EMA > 480 EMA;
Traders Dinamic Index Buy alert;
When the trend changes and the direction is up: buy the first arrow;
Re-entry (very important)
when the price touches or retraces into the tunnel (colour yellow);
You can to confirme the long entry with the SSA line deep sky blue is > of the SSA yellow line (this is optional).
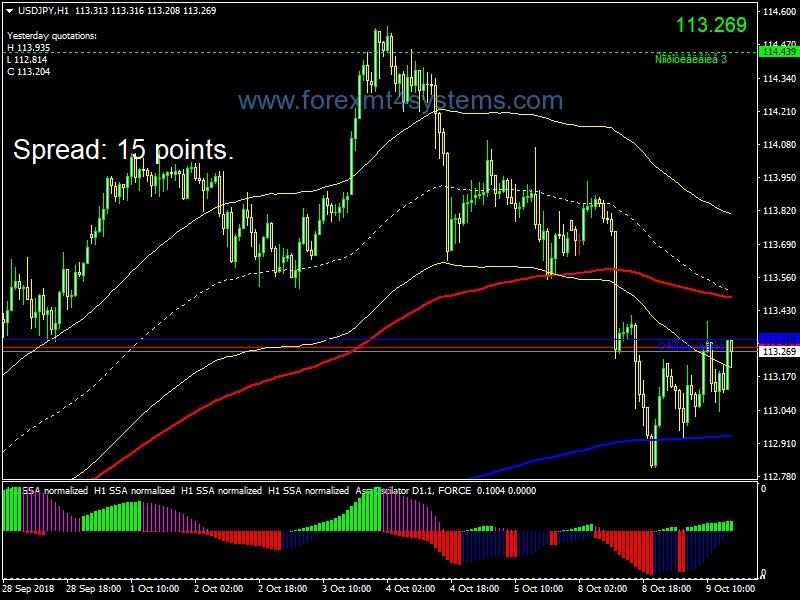
Sell
Price < 89 EMA < 200 EMA < 480 EMA;
Traders Dinamic Index Buy alert;
When the trend changes and the direction is up: buy the first arrow;
Re-entry (very important)
when the price touches or retraces into the tunnel (colour yellow);
You can to confirme the short entry with the SSA line deep sky blue is < of the SSA yellow line (this is optional).
Exit position
at the oppiste arrow or at the profit target predetermided.
Initial Stop loss at the previous swing.
Traders Dynamic Index
This hybrid indicator is developed to assist traders in their
ability to decipher and monitor market conditions related to
trend direction, market strength, and market volatility.
Even though comprehensive, the T.D.I. is easy to read and use.
Green line = RSI Price line
Red line = Trade Signal line
Blue lines = Volatility Band
Yellow line = Market Base Line
Trend Direction – Immediate and Overall
Immediate = Green over Red…price action is moving up.
Red over Green…price action is moving down.
Overall = Yellow line trends up and down generally between the
lines 32 & 68. Watch for Yellow line to bounces off
these lines for market reversal. Trade long when
price is above the Yellow line, and trade short when
price is below.
Market Strength & Volatility – Immediate and Overall
Immediate = Green Line – Strong = Steep slope up or down.
Weak = Moderate to Flat slope.
Overall = Blue Lines – When expanding, market is strong and
trending. When constricting, market is weak and
in a range. When the Blue lines are extremely tight
in a narrow range, expect an economic announcement
or other market condition to spike the market.
Entry conditions
Scalping – Long = Green over Red, Short = Red over Green
Active – Long = Green over Red & Yellow lines
Short = Red over Green & Yellow lines
Moderate – Long = Green over Red, Yellow, & 50 lines
Short= Red over Green, Green below Yellow & 50 line |
Exit conditions*
Long = Green crosses below Red
Short = Green crosses above Red
* If Green crosses either Blue lines, consider exiting when
when the Green line crosses back over the Blue line.
IMPORTANT: The default settings are well tested and proven.
But, you can change the settings to fit your
trading style.
Price & Line Type settings:
RSI Price settings
0 = Close price [DEFAULT]
1 = Open price.
2 = High price.
3 = Low price.
4 = Median price, (high+low)/2.
5 = Typical price, (high+low+close)/3.
6 = Weighted close price, (high+low+close+close)/4.
| RSI Price Line & Signal Line Type settings
0 = Simple moving average [DEFAULT]
1 = Exponential moving average
2 = Smoothed moving average
3 = Linear weighted moving average
Good trading,
In forex a trading strategy is a fixed plan that is designed to achieve a profitable return by going long or short in markets. The main reasons that a properly researched trading strategy helps are its verifiability, quantifiability, consistency, and objectivity.
For every trading strategy one needs to define assets to trade, entry/exit points and money management rules.
How to install Forex Tunnel Dynamic Index Swing Trading Strategy?
- Download Forex Tunnel Dynamic Index Swing Trading Strategy.zip
- Copy mq4 and ex4 files to your Metatrader Directory / experts / indicators /
- Copy tpl file (Template) to your Metatrader Directory / templates /
- Start or restart your Metatrader Client
- Select Chart and Timeframe where you want to test your forex strategy
- Load indicator on your chart
How to uninstall Forex Tunnel Dynamic Index Swing Trading Strategy?
To shut down an indicator, one has to remove it from the chart. At that, its drawing and recalculation of its values will stop. To remove an indicator from the chart, one has to execute its context menu commands of “Delete Indicator” or “Delete Indicator Window”, or the chart context menu command of “Indicators List – Delete”.