Forex Best Rend Line Trading Strategy
Forex Best Rend Line Trading Strategy;
Best trend line DeMark template is a trend following and price action system filtered by momentum. This trading system is good for intraday and for swing trading.
Time Frame 30 min, H1 and H4.
Currency pairs: majors.
Metatrader Indicators:
Rainbow (a set moving averages);
3 Level ZZ Semafor,
DeMark Trendline trader,
Info indicator;
Polynomial regression;
VS Pivots,
1 a indicator ;
Relative Strenght Index (period 14);
Arcay Indicator.
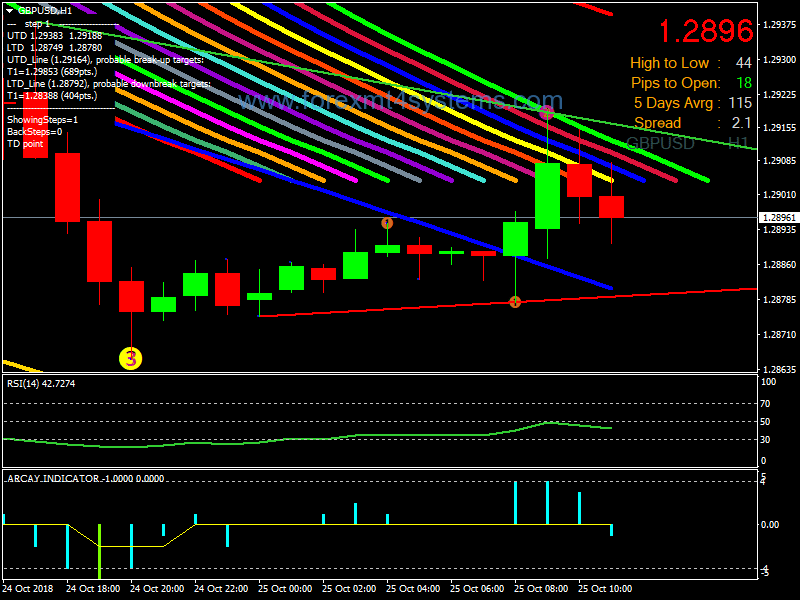
Rules Best trend line trader DeMark template
Trade only in direction of the trend.
Buy
Price action candle broken trendline trader DemarK above the rainbow.
Polynomial regression pointing up.
Relative Strenght Index (momentum) above 50 level.
Arcay indicator bar above yellow line.
Sell
Price action candle broken trendline trader DemarK below the rainbow.
Polynomial regression pointing down.
Relative Strenght Index (momentum) below 50 level.
Arcay indicator bar below yellow line.
Exit positions
Ratio Stop loss 1.2. , initial stop loss on the previous swing.
In forex a trading strategy is a fixed plan that is designed to achieve a profitable return by going long or short in markets. The main reasons that a properly researched trading strategy helps are its verifiability, quantifiability, consistency, and objectivity.
For every trading strategy one needs to define assets to trade, entry/exit points and money management rules.
How to install Forex Best Rend Line Trading Strategy?
- Download Forex Best Rend Line Trading Strategy.zip
- Copy mq4 and ex4 files to your Metatrader Directory / experts / indicators /
- Copy tpl file (Template) to your Metatrader Directory / templates /
- Start or restart your Metatrader Client
- Select Chart and Timeframe where you want to test your forex strategy
- Load indicator on your chart
How to uninstall Forex Best Rend Line Trading Strategy?
To shut down an indicator, one has to remove it from the chart. At that, its drawing and recalculation of its values will stop. To remove an indicator from the chart, one has to execute its context menu commands of “Delete Indicator” or “Delete Indicator Window”, or the chart context menu command of “Indicators List – Delete”.