Introduction to the Golden Line V4 Indicator
The Golden Line V4 Indicator is a popular technical analysis tool used by forex traders to identify potential market entry and exit points. It provides traders with buy and sell signals and aims to predict future price movement and trends.
The indicator was first introduced in 2016 and has gone through several iterations, with the latest version being the Golden Line V4. It is compatible with the MetaTrader 4 and 5 trading platforms and can be used on any timeframe or currency pair.
Some key features of the Golden Line V4 Indicator include:
- Uses price action analysis to generate trading signals
- Provides clear arrows and dots to indicate buy and sell signals
- Designed to identify potential trend reversals early
- Can be used across all timeframes and currency pairs
- Includes several built-in indicators like Moving Averages and Heiken Ashi candles
In this comprehensive review, we will take an in-depth look at how the Golden Line V4 Indicator works, its main trading rules and strategies, pros and cons, and ultimately help you determine if it is the right indicator for your trading style and goals.
Download Free GOLDEN LINE V4 INDICATOR
How the Golden Line V4 Indicator Generates Signals
The Golden Line V4 Indicator is composed of several components that work together to analyze price action and momentum in order to generate high-probability trading signals.
The main elements of the indicator include:
Heiken Ashi candles are a type of Japanese candlestick chart that smooth out price action and make it easier to identify trends. The indicator uses these candlesticks to determine the overall market trend.
Two moving averages are plotted on the chart – a faster moving average and a slower one. Crossovers between the two moving averages help identify trend direction and strength.
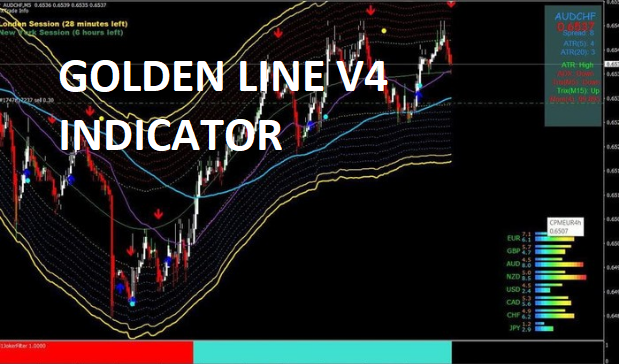
Colored arrows are plotted on the chart pointing up for buy signals and down for sell signals. These appear when certain criteria are met (explained below).
Buy and Sell Dots
Dots also appear on the chart to further confirm the arrow signals. The buy dots are blue while the sell dots are yellow.
A separate window indicates if the overall trend is up or down. This provides additional context for the trades.
Upper and lower price channels represent overbought and oversold levels and provide trade entry zones.
Trading Strategies and Rules
The developer of the Golden Line V4 Indicator recommends two main trading strategies:
Strategy 1
Buy Signal
A buy signal occurs when:
- Heiken Ashi candle enters or touches the lower blue zone
- Heiken Ashi candle touches the faster moving average
- A blue dot appears in the buy zone
- The slower moving average is above the faster moving average
- The trend strength indicator is blue
Sell Signal
A sell signal occurs when:
- Heiken Ashi candle enters or touches the upper red zone
- Heiken Ashi candle touches the faster moving average
- A yellow dot appears in the sell zone
- The slower moving average is below the faster moving average
- The trend strength indicator is red
Exit Signal
Close the trade when the opposite signal dot appears – i.e. close buy trades when the yellow dot appears and sell trades when the blue dot appears.
Strategy 2
This strategy involves looking for consecutive arrows in the direction of the trend:
Buy Signal
- Find two consecutive blue up arrows in the buy zone
- The second arrow should be near or touching the upper price channel
- Close when the yellow dot appears
Sell Signal
- Find two consecutive red down arrows in the sell zone
- The second arrow should be near or touching the lower price channel
- Close when the blue dot appears
Pros and Cons of Using the Golden Line V4 Indicator
Pros
- Provides clear buy and sell signals for easy trade entry
- Can identify potential trend reversals early
- Works well for scalping and day trading strategies
- Suitable for beginner traders due to its simplicity
- Low lag between signal and price movement
- Works across all currency pairs and timeframes
Cons
- Too many signals can lead to overtrading
- Works best in trending market conditions
- Some repainting may occur occasionally
- Requires monitoring the charts constantly
- Needs swift action to enter on signals
- Exits are not defined clearly
Using the Indicator Effectively
Here are some tips to use the Golden Line V4 Indicator successfully:
- Use it on the recommended timeframes of 5, 15, or 30 minutes. The 1 hour and 4 hour charts can be used for trend analysis.
- Trade in the direction of the overall trend – use a higher timeframe or the trend strength indicator to determine the trend.
- Be selective with trades – avoid taking every signal, only focus on high probability setups.
- Define your risk-reward ratios and use stop losses to manage risk.
- Use price action confirmation like candlestick patterns to further validate signals.
- Combine it with other indicators like MACD or Stochastics for greater accuracy.
- Stick to one trading strategy instead of mixing multiple strategies.
Performance Review
The Golden Line V4 Indicator can provide a solid accuracy rate in the 60-75% range when used properly. However, as with any indicator, performance depends greatly on the market environment and the trader’s skill.
In trending markets with strong momentum, the indicator tends to perform very well with most signals aligning accurately in the direction of the trend. During ranging, choppy markets, there are likely to be more false signals and lower accuracy.
For best results, traders must exercise good judgment in confirming signals, managing risk, and following the indicator’s rules. While the Golden Line V4 can spot potential trades, it takes skill and experience to convert them into consistent profits.
Overall, the indicator can be a valuable addition to a trader’s toolbox when used with proper strategies. But it should not be solely relied on – price action and other analysis are still crucial.
GOLDEN LINE V4 INDICATOR Final Verdict
The Golden Line V4 Indicator can be a good choice for novice traders looking for a simple, visual indicator to assist with trade entries and exits. The clear signals make it easy to implement in strategies.
However, more experienced traders may find it too basic, as it lacks nuanced analysis. The main appeal lies in its ease of use.
For the indicator to be effective, traders need to use good risk management and combine it with other techniques. Relying solely on Golden Line V4 signals is unlikely to end well.
The best application tends to be with short-term trading strategies on lower timeframes when markets are trending. Using it properly requires monitoring the charts closely and acting swiftly on high probability signals.
While not a magic bullet, the Golden Line V4 Indicator can be a useful addition to a well-rounded trading approach for newer traders. With practice and experience, it can help boost strategy performance.

