The Powerful G Trend Indicator: A Comprehensive Review
The G Trend indicator has become an increasingly popular technical analysis tool among traders in recent years. This indicator provides a simplified method for identifying trends and potential reversals on any timeframe. In this comprehensive review, we will explore what the G Trend indicator is, how it works, its key features and customization options, as well as actionable trading strategies you can implement using this versatile indicator.
Download Free G Trend Indicator
What is the G Trend Indicator?
The G Trend indicator was originally created by forex trader Luis Gandara and made available as an open-source custom indicator on TradingView. It aims to follow trends based on higher open or close prices depending on the direction of the trend.
In simple terms, the indicator plots a simple moving average line in the direction of the current trend. During uptrends, the line connects higher highs, while in downtrends, it connects lower lows. The color of the line changes based on trend direction – green for uptrend and red for downtrend.
Some key features of the G Trend indicator include:
- Identifies current trend direction
- Plots average line in direction of trend
- Changes color based on bullish/bearish trend
- Smooth line with minimal repainting
- Customizable parameters
By distilling trend identification down to its most basic elements of higher highs and lower lows, the G Trend provides an unfussy method to define and trade with the trend across any market or timeframe.
How the G Trend Indicator Works
The mechanics behind the G Trend indicator are relatively straightforward. The indicator plots a simple moving average line that connects either swing highs or swing lows based on the direction of the prevailing trend.
Uptrend Conditions
During uptrend conditions when price is making a series of higher highs and higher lows, the indicator will plot a simple moving average line that connects the recent swing highs.
As long as price remains above the G Trend line, the uptrend is considered intact. However, if price breaks back below the line, this signals a potential trend reversal from up to down.
Downtrend Conditions
In downtrend conditions when price is printing lower highs and lower lows, the G Trend plots a simple moving average line anchored to recent swing lows.
In this case, as long as price remains below the indicator line, the downtrend remains valid. If price rallies above the line, it signals a possible trend reversal from down to up.
By dynamically connecting higher highs or lower lows based on trend direction, the G Trend indicator elegantly defines the trend with a smooth, sloping line. The angle of the line also gives clues as to the strength of the trend – steeper angles indicate a stronger trend.
Key Features and Customization
The G Trend comes packed with several useful features:
Trend Direction
As covered earlier, the slope and color of the line clearly defines whether price is in an uptrend (green) or downtrend (red). This takes the guesswork out of trend identification.
Smooth Line
The simple moving average line plots a smooth trend with minimal repainting, allowing traders to identify reliable dynamic support and resistance levels.
Customizable Parameters
The indicator has several customizable input parameters so traders can adjust it to suit their style and timeframe:
- Length: The lookback period for the simple moving average line. Default is 20.
- Multipier: Scales the size of the indicator’s range. Default is 1.
- Show Price: Toggles display of price labels on chart.
- Line Width: Sets width of the indicator line.
Alerts
The ability to set alerts when price crosses above or below the indicator line allows traders to get real-time notifications of trend reversals or breakouts without having to stare at the chart all day.
Overall, the straightforward nature yet customizability of the G Trend makes it applicable across any market and timeframe.
G Trend Trading Strategies
The G Trend can be used alone or combined with other indicators as part of a trading system. Here are some effective strategies to consider:
G Trend Price Crossovers
This is the most basic method using solely the G Trend. A bullish crossover occurs when price breaks above the indicator line, signaling an uptrend. A bearish crossover occurs when price drops below the line, signaling a downtrend.
After identifying the new trend direction, traders can look to enter new long or short positions in the direction of the emerging trend. Initial stop loss orders can be placed the other side of the indicator line.
G Trend With Moving Averages
Adding a moving average indicator such as the 50 or 200 SMA helps provide smoother entries and exits. After a G Trend bullish or bearish crossover, we can wait for a moving average crossover in the same direction for confirmation before entering a trade.
Stop losses on longs can be placed below the moving average, while stops on shorts can be placed above the moving average. This helps filter out false breakouts.
G Trend With Other Indicators
The G Trend can be combined with leading indicators such as the RSI or stochastic for additional trade confirmation. As an example system:
- Long Entry: Price crosses above G Trend line + RSI breaks above 50
- Short Entry: Price crosses below G Trend line + RSI breaks below 50
The key is identifying trades in the direction of the new trend identified by the G Trend indicator. Multiple confirmations improve accuracy.
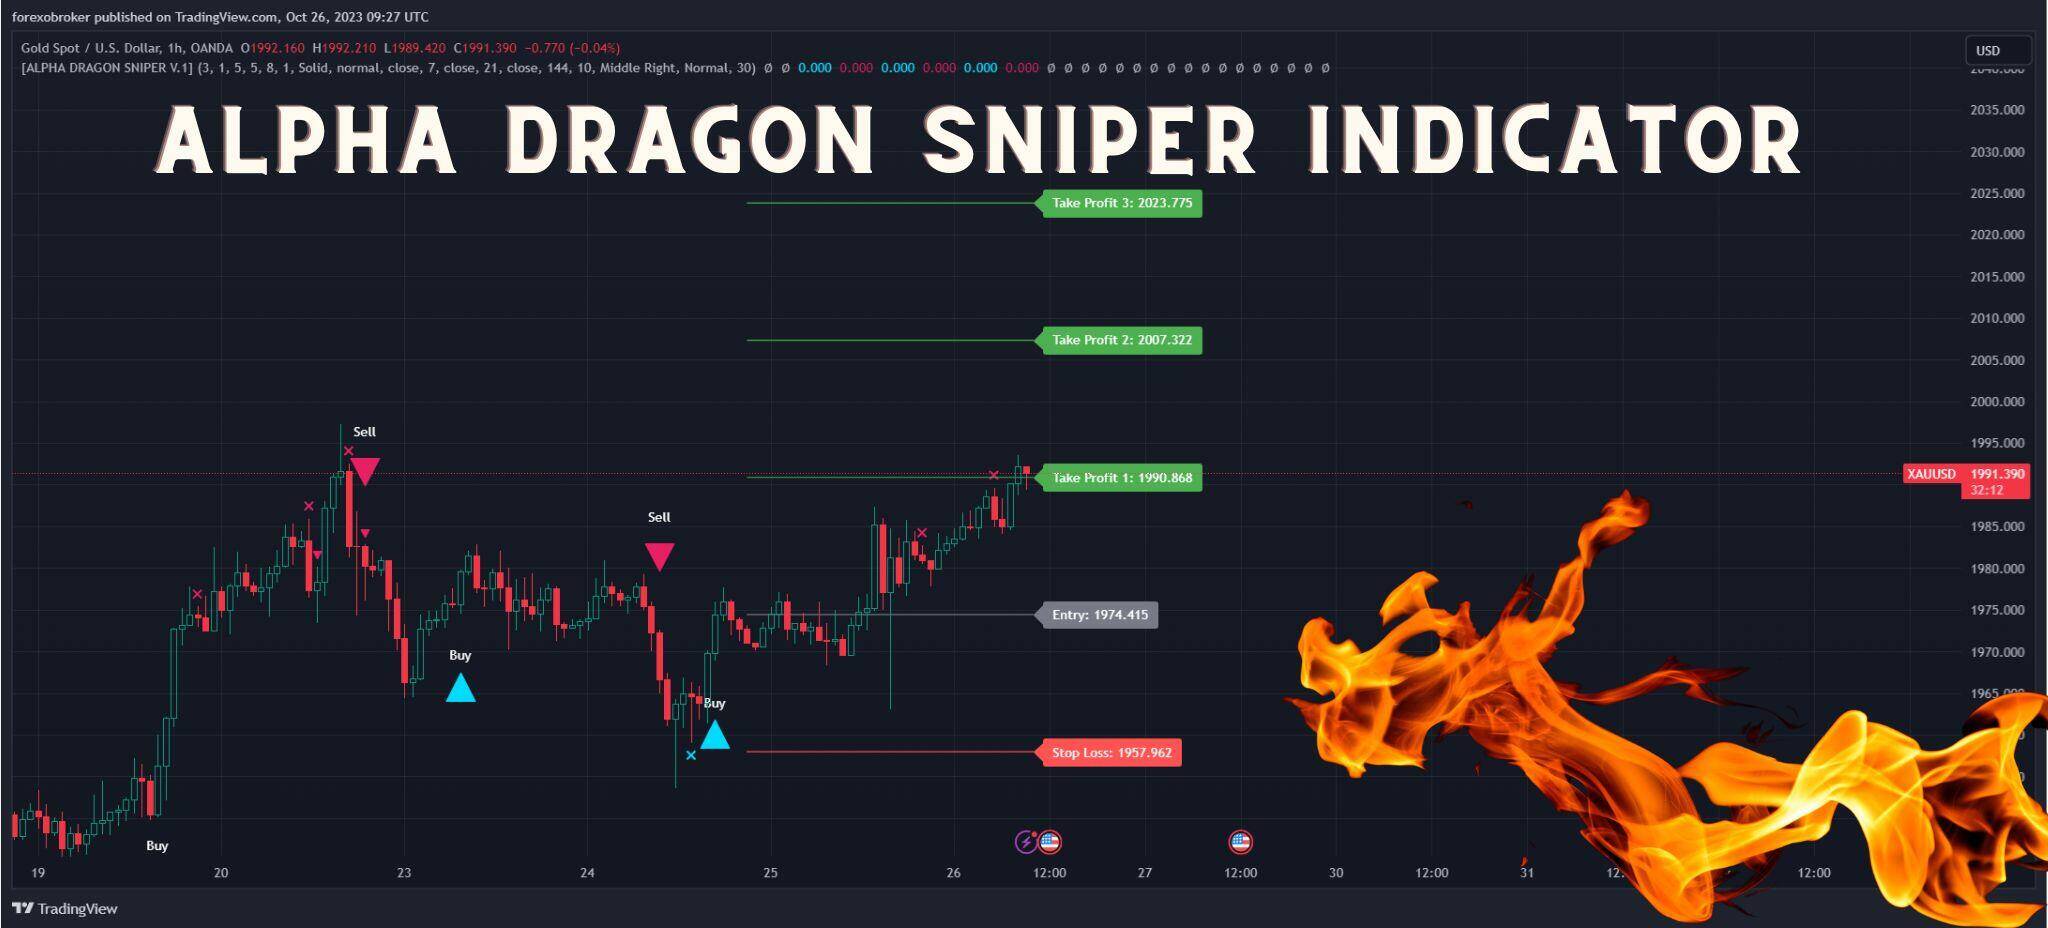
Download new Alpha Dragon Sniper Indicator
G Trend With Chart Patterns
The indicator can also be used to confirm classical chart patterns like triangles, flags and wedges. A G Trend line breakout in the direction of the anticipated chart pattern breakout provides additional confidence for entering trades based on these continuation or reversal patterns.
As seen, the G Trend provides traders an adaptable indicator for creating simple or complex trend trading systems across any market or timeframe.
Benefits of Using the G Trend Indicator
After covering how it works and potential trading tactics, let’s summarize some of the key benefits of using the G Trend indicator:
Easy Visual Identification of Trend
The color-coded sloped line clearly highlights the prevailing trend direction and strength without cluttering up the chart.
Smooth Plotting with Minimal Repainting
The simple moving average line plots smoothly with minimal backpainting, allowing traders to identify reliable dynamic support and resistance levels.
Objective Signals for Longs and Shorts
Crossovers of the indicator line provide objective, rules-based signals for entering long and short trades in the direction of the emerging trend.
Works Across Any Market
The robust signals generated by the G Trend makes it widely applicable across forex, stocks, commodities, cryptocurrencies, and any other freely-traded market.
Customizable Parameters
The ability to tweak parameters like the length and multiplier gives traders flexibility to optimize the indicator’s sensitivity for different market conditions and timeframes.
Enhances Any Trading Style
From basic technical analysis to advanced systems, the G Trend integrates seamlessly with other indicators and chart patterns, making it a valuable addition to any trader’s toolbox.
As demonstrated, the simplicity yet versatility of the G Trend gives traders an edge in determining trend direction across any timeframe or trading style.
Limitations of the G Trend
While the G Trend has numerous advantages, traders should also be aware of some potential limitations:
Lagging Nature
Like all trend following indicators, the G Trend lags price action and does not lead or predict future moves. The trend is only identified once a swing high or low has already formed.
Late Signals
Related to its lagging nature, signals are always late so the indicator does not identify optimal entry and exit points. Stop losses need to account for some adverse excursion.
Whipsaws
During periods of consolidation when there is no clear trend, the indicator line may whip back and forth leading to false signals. Adding filters like moving averages helps reduce whipsaws.
Repainting
While repainting has been minimized, some backpainting of the line still occurs which may cause the plotted historical trend to look slightly different with each refresh.
No Standalone Trading System
The G Trend works best when combined with other indicators or analysis techniques rather than as a pure mechanical trading system.
Being aware of these limitations allows traders to anticipate them and account for them in their trading plan. Using prudent position sizing, risk management and confirming signals enhances profitable implementation of the G Trend indicator.
Conclusion
The G Trend delivers a unique take on trend identification by connecting simple moving average highs or lows based on the direction of the prevailing trend. The color-coded smoothed line clearly highlights not only trend direction but also strength and reversals.
While simple in concept, the indicator provides a solid foundation for building rule-based trading strategies across any market or timeframe. The trend-defining signals can be used on their own or combined with other technical analysis tools.
Of course, like with any indicator, the G Trend has some drawbacks traders should be familiar with. However, used prudently within the context of broader market analysis, the G Trend offers traders an adaptable tool to spot emerging trends and stay one step ahead of turning points.
So if you are looking to enhance your trend trading tactics, give the G Trend indicator a try! Integrate it into your existing process and witness first-hand its effectiveness in identifying profitable, low-risk trade setups based on the prevailing trend.
