Forex Zig Zag Histogram Binary Options Strategy
Forex Zig Zag Histogram Binary Options Strategy;
Zig Zag Hist system is a strategy based on the zig zag indicator. This strategy is for is good for trading also with binary options high/low.
Time Frame 1min or higher.
Financial Markets: any.
Binary Options High/low expiry time 1-2 candles.
Metatrader Indicators:
Moving average 2 period close (optional).
Moving average 3 period close (optional),
Moving average 200 period close, (only for 1 min time frame, optional),
Zig Zag hist (12, 5, 3),
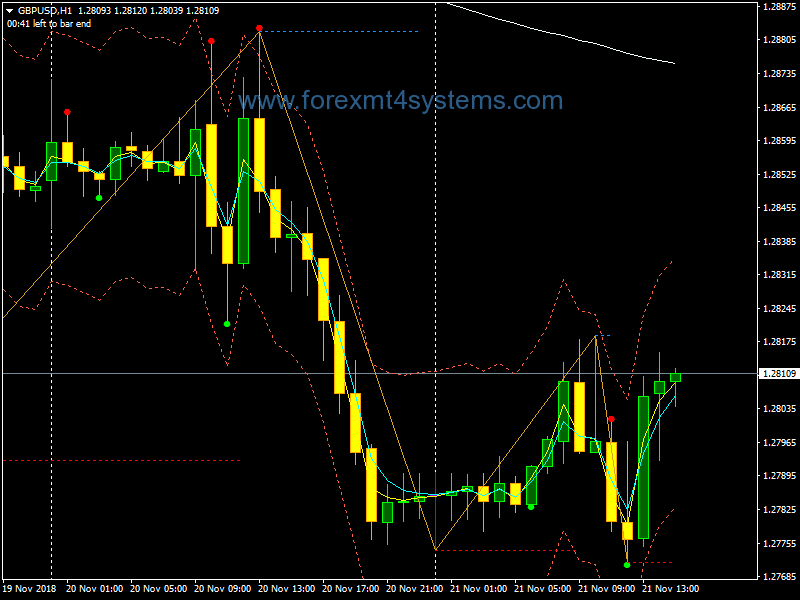
Sixty second trades.
Trading rules for 60 second time frame.
Trades only in the direction of the 200 EMA (optional).
Buy
Line red dotted
Sixty second trades green dot.
Sell
Line blue dotted
Sixty second trades red dot.
For re-entry you can also use the cross of the EMA’s fast.
Re-entry expiry time 1-2 candles.
Buy green dot+cross.
Sell red dot + cross.
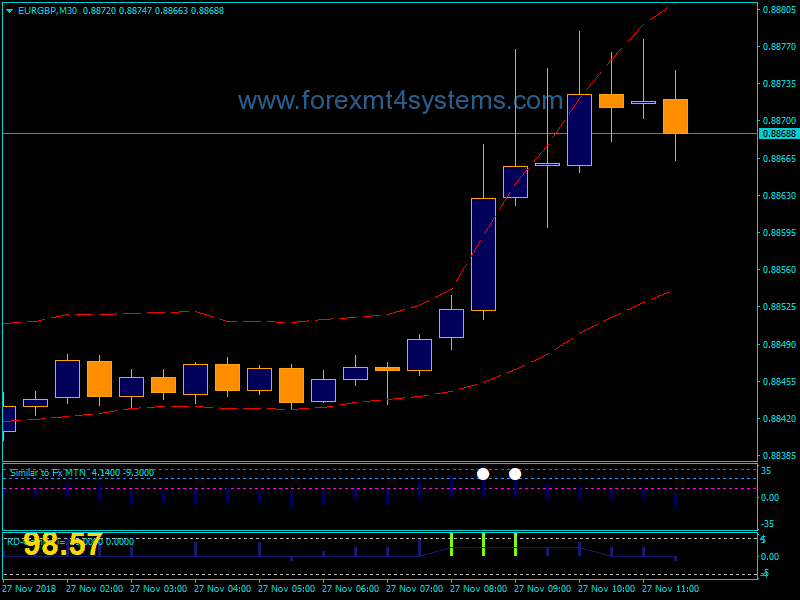
Intraday Trading 5min, 15 min, 30min.
The same rules with 55 EMA
Buy
Price above 55 EMA
Line red dotted
Sixty second trades green dot.
Sell
Price Below 55 EMA
Line blue dotted
Sixty second trades red dot.
Exit with predetermined profit target or at opposite arrow.
In forex a trading strategy is a fixed plan that is designed to achieve a profitable return by going long or short in markets. The main reasons that a properly researched trading strategy helps are its verifiability, quantifiability, consistency, and objectivity.
For every trading strategy one needs to define assets to trade, entry/exit points and money management rules.
How to install Forex Zig Zag Histogram Binary Options Strategy?
- Download Forex Zig Zag Histogram Binary Options Strategy.zip
- Copy mq4 and ex4 files to your Metatrader Directory / experts / indicators /
- Copy tpl file (Template) to your Metatrader Directory / templates /
- Start or restart your Metatrader Client
- Select Chart and Timeframe where you want to test your forex strategy
- Load indicator on your chart
How to uninstall Forex Zig Zag Histogram Binary Options Strategy?
To shut down an indicator, one has to remove it from the chart. At that, its drawing and recalculation of its values will stop. To remove an indicator from the chart, one has to execute its context menu commands of “Delete Indicator” or “Delete Indicator Window”, or the chart context menu command of “Indicators List – Delete”.