Forex WATL Wave Auto Trend Lines Trading Strategy
Forex WATL Wave Auto Trend Lines Trading Strategy;
Wave_AutoTrendLines (WATi) is a complex technical tool which gives new technology of the price analysis.
Certainly, indicator WATi does not cancel existing positions of the classical graphic analysis, Elliott’s theory and other developments in the field of the technical analysis.
Therefore, on one hand, indicator WATi is the good assistant for identification and visual definition of classical price models. On the other hand, it forms the new point of view on principles of market price behavior analysis.
Therefore, on one hand, indicator WATi is the good assistant for identification and visual definition of classical price models. On the other hand, it forms the new point of view on principles of market price behavior analysis .
During long testing, it was revealed, that indicator VATI creates own models on the price chart using semaphores and trend lines. . Many of them are components of classical price models, but some of them have unique shape, peculiar only
for this indicator. Such feature only expands practical opportunities of the indicator WATi use.
Finally, any tool of similar type is intended to help organize successful trading activity in the markets. Therefore
indicator WATi can be useful to you in following cases:
1. For visual definition of classical price models: Head -shoulders, 123 pattern, Banners, Pennants and others
2. For visual identification of «Likhovidov folding rule» price model
3. For definition of formation places and construction of WOLFE WAVES
4. For use together with B.William’s system “Alligator”
5. For the simplified wave analysis and Elliot wave model identification.
Indicator WATi consists of 3 basic elements:
1. Semaphores of the High, Low and Lowest periods
The semaphores color marks by default:
The High period – red circle with 3;
The Low period – yellow circle with 2;
The Lowest period – violet points;
2. Trend lines of the High and an Low periods
Trend lines marks by default:
The High period – a red faltering line;
The Low period – a yellow continuous line;
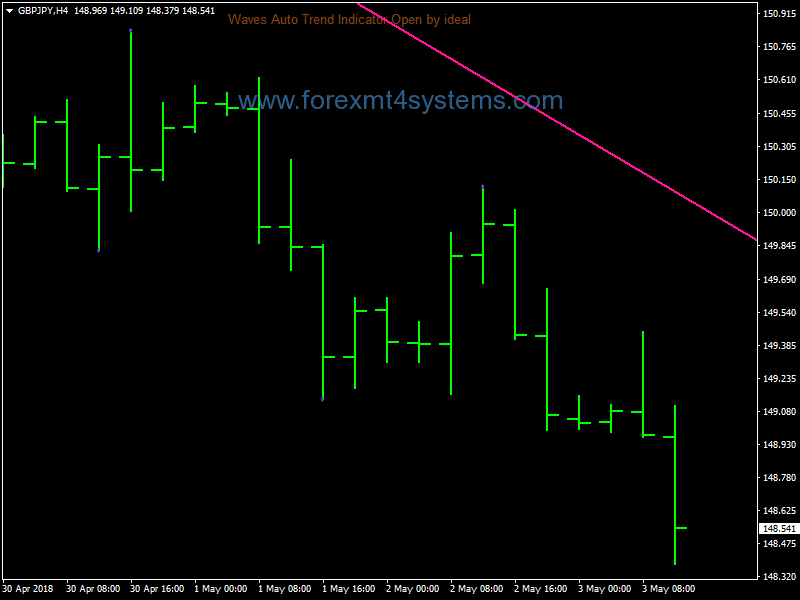
3. The forecast trend line of the High period.
Marks of a line by default:
Pink line.
Indicator WATi trend lines assist to visually identifying «Likhovidov folding rule» price model».
Process of definition of «Likhovidov folding rule» price model consists of several stages, namely:
1. Definition of wave forms.
2. Construction of trend lines.
Trend lines should allocate and emphasize wave forms which develop the tendency movement. Horizontal movements, in
this case, do not interest us.
In forex a trading strategy is a fixed plan that is designed to achieve a profitable return by going long or short in markets. The main reasons that a properly researched trading strategy helps are its verifiability, quantifiability, consistency, and objectivity.
For every trading strategy one needs to define assets to trade, entry/exit points and money management rules.
How to install Forex WATL Wave Auto Trend Lines Trading Strategy?
- Download Forex WATL Wave Auto Trend Lines Trading Strategy.zip
- Copy mq4 and ex4 files to your Metatrader Directory / experts / indicators /
- Copy tpl file (Template) to your Metatrader Directory / templates /
- Start or restart your Metatrader Client
- Select Chart and Timeframe where you want to test your forex strategy
- Load indicator on your chart
How to uninstall Forex WATL Wave Auto Trend Lines Trading Strategy?
To shut down an indicator, one has to remove it from the chart. At that, its drawing and recalculation of its values will stop. To remove an indicator from the chart, one has to execute its context menu commands of “Delete Indicator” or “Delete Indicator Window”, or the chart context menu command of “Indicators List – Delete”.