Understanding the Trend Line Map Pro Indicator
The Trend Line Map Pro indicator is an add-on for the Trend Screener indicator. It works as a scanner to display signals generated by the Trend Screener, specifically the trend line signals. The Trend Line Map plots these signals on a dashboard to provide an easy visualization of potential trading opportunities.
Download Free Trend Line Map Pro indicator
How the Trend Line Map Pro Works
The Trend Line Map relies entirely on the Trend Screener indicator to function. Without having the Trend Screener installed on your trading platform, the Trend Line Map will not work.
Once you have the Trend Screener indicator installed, the Trend Line Map scans the chart across multiple timeframes, looking for trend line signals generated by the Trend Screener. When the Trend Screener identifies a potential buy or sell signal based on an upward or downward trend line, the Trend Line Map plots this on its dashboard.
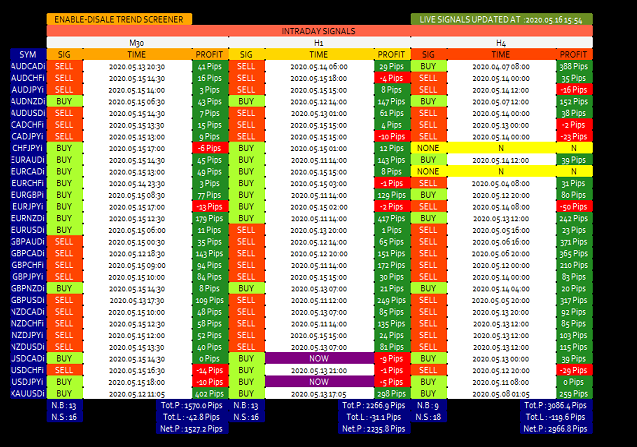
The dashboard displays the following information:
- Buy and sell signals – Based on the Trend Screener’s analysis of trend lines on the chart
- Signal timing – The exact time the signal was triggered
- Live P/L – The current profit or loss of the signal in pips
- Number of buy and sell signals – A counter of the total number of buy and sell signals
In this way, the Trend Line Map provides an easy way to visualize the Trend Screener signals across multiple currency pairs and timeframes, without having to manually scan through charts.
Key Benefits of the Trend Line Map
There are several advantages to using the Trend Line Map Pro indicator:
- Saves time – No need to manually analyze charts for trend line signals. The indicator scans and plots signals automatically.
- Visual dashboard – Simple and intuitive display of potential trading opportunities in one dashboard.
- Multiple timeframes – Scans trend line signals across multiple timeframes from M30 up to monthly.
- Alerts – Optional alerts notify you when a new signal is identified.
- Tracks profit/loss – Displays live P/L so you can easily monitor performance of current signals.
By condensing signals into an easy-to-read dashboard, the Trend Line Map makes it simple to identify and evaluate trading opportunities based on the Trend Screener’s analysis.
Using the Trend Line Map Effectively
To use the Trend Line Map effectively, the first step is ensuring you have the Trend Screener indicator installed and configured properly. The Trend Line Map relies entirely on the Trend Screener, so it is crucial to have the Trend Screener optimized for your trading approach.
Once the Trend Screener is up and running, attach the Trend Line Map indicator to your charts. You’ll immediately see the dashboard populate with any existing trend line signals on those currency pairs and timeframes.
By default, the Trend Line Map scans all available currency pairs in your platform across the M30, H1, H4, D1, W1 and MN timeframes. You can limit the pairs and timeframes scanned in the indicator settings if you wish to narrow the focus.
When a new trend line signal is triggered by the Trend Screener, it will instantly appear on the Trend Line Map dashboard. Use the information on timing, direction, and emerging profit/loss to evaluate if you want to take action on the signal.
Set up alerts in the Trend Line Map to be notified when new signals are identified. This allows you to scan other charts manually, while still getting notified of any emerging opportunities.
Over time, analyze the performance metrics in the Trend Line Map dashboard to determine which signals are most profitable. You can then optimize entries and exits or adjust the Trend Screener settings to improve profitable signals.
Optimizing the Indicator Performance
The Trend Line Map indicator can be demanding on computer resources with its constant scanning across multiple pairs and timeframes. There are a few ways to optimize its performance:
- Limit currency pairs – Only enable scanning on relevant pairs to your trading strategy
- Increase update frequency – A lower update frequency reduces resource demand
- Ensure updated data – Download latest data for scanned pairs
- Limit chart timeframes – Disable higher timeframes (e.g. D1, W1) if not needed
Finding the right balance through testing will lead to smooth indicator performance. Be sure to disable unused features like alerts and profit tracking to further optimize computer usage.
Using Trend Line Map Pro Signals
Every trading strategy is different, but some general guidelines can be followed when evaluating Trend Line Map Pro signals:
- Focus on signals that align with the overall trend on higher timeframes
- Use other indicators to evaluate momentum and confirm signal validity
- Be selective and only act on high quality signals
- Determine ideal entry on lower timeframe after signal is triggered
- Move stop loss to break even once trade moves in your favor
The Trend Line Map Pro provides high probability signals based on trend lines produced by the Trend Screener. But as with any indicator signal, trade management, risk control and confirmation remain key to long-term trading success when putting these signals into practice.
Conclusion
With its scanner-style interface and visual dashboard, the Trend Line Map Pro for MT4 provides an outstanding companion tool for the Trend Screener indicator. It automates the tedious chart scanning process to surface potential trading opportunities across multiple pairs and timeframes based on Trend Screener trend line signals.
By condensing information into an intuitive dashboard, the Trend Line Map Pro saves traders time while enabling better opportunity evaluation and monitoring. Combined with robust trade management, this indicator solution offers a systematic approach for trend trading the forex markets.

