The Power of the Trend Screener Indicator: A Comprehensive Guide
The Trend Screener Indicator has become an invaluable tool for traders looking to identify and capitalize on market trends across various timeframes and instruments. This powerful indicator provides traders with an “at-a-glance” view of the market’s directional bias, allowing them to quickly determine whether to buy or sell. In this comprehensive guide, we will explore what makes the Trend Screener Indicator so effective, how to use it properly, and some tips to enhance your trading with this tool.
Download Free Trend Screener Indicator
What is the Trend Screener Indicator?
The Trend Screener Indicator is a custom indicator available for the MT4 and MT5 trading platforms. It utilizes advanced algorithms to analyze the market and determine the overall trend direction across multiple timeframes.
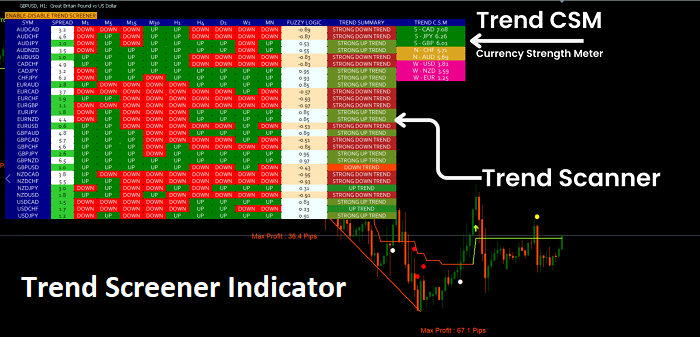
The indicator consists of three components:
- Intelligent Trend Indicator – The core signal indicator that identifies potential trend reversals and continuation through the use of colored arrows and trend strength meters.
- Intelligent Candle Pressure – A filter that shows real-time buying/selling pressure on the current candle across different timeframes.
- Intelligent Dashboard – A separate window that displays the trend direction and strength for up to 10 timeframes.
By combining these elements, the Trend Screener provides traders with robust trend analysis and high-probability entry signals for both new trades and trade management.
Key Benefits of Using the Trend Screener
There are several key benefits that make the Trend Screener Indicator an invaluable addition to any trading toolkit:
1. Real-time trend analysis across timeframes – The indicator scans up to 10 timeframes simultaneously, identifying the overall market bias. This allows traders to select high-probability entries in the direction of the prevailing trend.
2. Accurate entry signals – The indicator provides arrow-based entry signals right on the price chart. These signals have a high accuracy rate as they factor in trend direction, momentum, and candle pressure.
3. Trade management – The multi-timeframe dashboard and candle pressure indicator help traders determine ideal areas for trade entries, exits, and stop adjustments.
4. Customizable settings – Users can tweak the indicator’s sensitivity and other parameters to suit their trading style and market conditions. This flexibility allows further optimization of entry and exit timing.
5. Ease of use – With clear visual signals and an intuitive interface, the Trend Screener is simple to set up and interpret, even for novice traders.
6. Works across markets – The indicator can be used to trade forex, commodities, indices, stocks, and cryptocurrencies. This makes it applicable across various asset classes.
7. Risk management – By trading in the direction of the prevailing trend, traders can capitalize on high-probability setups and reduce trade risk exposure.
How to Install and Set Up the Indicator
The Trend Screener Indicator can be purchased online through various sources such as the MetaTrader Marketplace. Once purchased, here are the steps to install it:
- Download the indicator file to your computer.
- Locate and open the ‘MQL4’ or ‘MQL5’ folder on your MetaTrader platform. This is usually in the ‘File’ section.
- Copy or move the downloaded indicator file into the ‘Indicators’ folder.
- Restart your MetaTrader platform to allow it to recognize the newly added indicator.
- In the ‘Navigator’ panel, you should now see the Trend Screener Indicator ready to be added to any chart.
Once installed, the indicator can be customized by right-clicking on it and navigating to ‘Inputs’. From here, traders can modify parameters such as:
- Number of timeframes to scan
- Signal sensitivity
- Dashboard colors
- Arrows visibility
Modifying these settings allows traders to tune the indicator’s outputs to suit their preferences.
How to Interpret the Indicator
Learning to properly interpret the Trend Screener’s signals is key to utilizing it effectively. Here is a step-by-step guide:
1. Check the dashboard – First, look at the indicator’s dashboard at the top of the chart to see the overall trend bias across timeframes. If most timeframes are green, the trend is likely bullish. If most are red, it is likely bearish.
2. Identify entry signals – Next, look for colored arrows printed directly on the price chart. A green arrow indicates a potential long entry, while a red arrow indicates a short entry.
3. Confirm with candle pressure – Check that the candle pressure indicator aligns with the trend. If a long signal appears but candle pressure is negative, it warns of potential weakness so wait for confirmation.
4. Assess risk/reward – Evaluate the potential risk-reward ratio for the signal. Is the projected profit greater than the required risk (stop loss)? A ratio of at least 1:1 is recommended.
5. Consider trade size – Determine proper trade size based on your account, risk tolerance, and signal strength. Stronger signals warrant larger sizes.
By following these steps, traders can objectively evaluate the risk and reward dynamics of any signal produced by the indicator.
Using the Indicator for Trade Entries
The Trend Screener’s signals can be used to time entries and maximize trading edge. Here are some tips for using the indicator effectively:
- Trade with the trend – Enter long trades when the overall dashboard and candle pressure are green, and short trades when they are red. Avoid counter-trend trades.
- Confirm signals on higher timeframes – Use the M15 or H1 timeframes to confirm day trading signals on the M5 or M15 charts. Higher timeframe alignment provides reliability.
- Focus on high probability setups – Prioritize signals that form at key chart levels or after momentum surges in the trending direction. These tend to have the best risk/reward ratios.
- Consider momentum – Entering in the direction of an accelerating trend improves the likelihood of a larger profit. Surfing momentum is generally best practice.
- Use price action for confirmation – Wait for the signal candle to close before entering. Then place a stop loss just beyond the recent swing point in the opposite direction.
- Scale in – Consider splitting the intended trade size into smaller increments that can be scaled in as the move extends. This helps reduce downside risk.
By applying these methods, traders are more likely to capture moves with a favorable risk-reward balance.
Using the Indicator for Trade Management
In addition to identifying new trades, the Trend Screener is also valuable for managing open positions and securing profits. Here are some management tips:
- Ride the trend – Hold positions open for as long as the dashboard, candle pressure, and price action align with the trend direction. Let profits run.
- Use candle pressure for exits – When candle pressure flips opposite to the open trade, it warns of waning momentum. Consider exiting fully or partially.
- Trail stops – As the position becomes profitable, trail the stop loss under swing points in the direction of the trend to lock in gains.
- Book partial profits – Scale out of large winning trades by closing a portion such as 50% at key levels to guarantee some profit is captured.
- Flip trades – If the indicator flips, showing a reversal, exit and look to enter the new emerging trend. Riding momentum in both directions is often most profitable.
- Cut losses quickly – If a stop loss is triggered, close the full position immediately and do not look back. Avoid averaging down.
Applying prudent trade management allows traders to systematically build on winners while reducing losses. This supports long-term profitability.
Optimizing the Indicator
The Trend Screener Indicator is highly customizable and traders can optimize its effectiveness by adjusting it to different market conditions. Here are some optimization tips:
- Adjust dashboard timeframes – Try different dashboard timeframe combinations to identify which ones provide the most reliable trend bias for the traded instrument.
- Modify sensitivity – Increase sensitivity in choppy markets for quicker signals, and decrease it in strong trending markets to avoid false signals.
- Use on higher timeframes – Run the indicator on the H4 or Daily charts to find the primary trend, and then drill down to lower timeframes for entry triggers.
- Combine with other indicators – Use indicators like the 200-period Moving Average to confirm trend direction and improve signal accuracy.
- Backtest settings – Backtest to measure the win rate and risk metrics of different Trend Screener parameter combinations. Optimize based on the statistics.
- Track performance – Keep a trading journal recording your results with the indicator. Tweak it over time if profits start deteriorating.
By regularly reviewing performance and testing adjustments, traders can refine the inputs to maintain optimal results.
The Power of Multiple Timeframe Analysis
One of the core strengths of the Trend Screener Indicator is its use of multiple timeframes to determine the trend, which leverages the power of multi-timeframe analysis. Here are some key benefits:
- Filters noise – Analyzing multiple timeframes filters out the noise and smaller moves on lower timeframes, focusing only on the most significant trend.
- Spots larger moves – Larger trending moves visible on higher timeframes are often more tradable than the choppy action on lower timeframes.
- Determines strength – If higher and lower timeframes align, it indicates a particularly strong trend that is worth trading.
- Confirms reversals – Reversals are high probability when confirmed by a flip in trend on both lower and higher timeframes.
- Improves risk management – Trading in the direction of the larger trend improves risk/reward ratios and win percentages.
By harnessing multiple timeframes, traders can concentrate solely on the highest conviction trading opportunities in markets. The Trend Screener makes this process efficient and systematic.
Common Trading Strategies
The Trend Screener Indicator is flexible enough to work with most trading strategies focused on trend following. Here are three of the most common strategies traders use it with:
Breakout Strategy
This strategy looks to enter trades in the direction of the trend after a period of consolidation when price breaks out forcefully to new highs or lows. The Trend Screener identifies both the trend and momentum surge, making breakout entries more timely and accurate.
Pullback Strategy
In this strategy, traders look to buy dips in an uptrend or sell rallies in a downtrend, entering at retracements back to value. The indicator identifies both the prevailing trend and temporary pullbacks within it.
Momentum Strategy
This strategy aims to capitalize on accelerating trends by entering when the Trend Screener shows strong momentum confirming the trend direction. Surfing momentum in the trend’s direction is a high-probability approach.
The Trend Screener works well with any strategy that aims to trade in the direction of the trend. Traders should determine which strategy best fits their risk profile and preferences.
The Importance of Following the Trend
One of the key concepts behind using the Trend Screener Indicator is that it aims to identify and follow the direction of the prevailing trend across timeframes. But why is following the trend so important in trading?
Here are several reasons trend trading is vital:
- Trending moves capture the bulk of market profits.
- Trading with momentum improves win rates and risk/reward ratios.
- Pullbacks and reversals provide low-risk entries in the trend’s direction.
- Stop losses are kept smaller when trading with the trend.
- Analysis becomes simpler when focused only on one direction.
- Trends persist due to sustained market sentiment and order flow.
In essence, by piggybacking on the dominant trend reflected by the Trend Screener, traders are simply taking the path of least resistance in the market. This leads to greater efficiency in trading.
Pitfalls to Avoid
While the Trend Screener Indicator can significantly improve trading results, traders should avoid some common pitfalls:
Going Against the Trend
Fighting against the primary trend is dangerous and lowers win rates. Only take counter-trend trades when momentum flips on multiple timeframes.
Over-Optimizing
While optimizing is good, over-optimizing indicator settings to fit past data could reduce effectiveness on new data. Avoid curve-fitting.
Not Using Stop Losses
Always use a stop loss on every trade to control downside risk, regardless of how strong the signal appears.
Forgetting Risk Management
Neglecting proper position sizing and risk management can lead to account wipeouts. Follow sound practices.
Trading Too Frequently
Patience is a virtue in trading. Avoid over-trading and wait for only the highest probability Trend Screener signals.
By being aware of these pitfalls and taking steps to avoid them, traders can improve their outcomes with the indicator.
Trend Screener Indicator Conclusion
The Trend Screener Indicator provides traders with a robust multi-timeframe trend analysis system that can significantly increase the accuracy of trade signals. By combining aspects of momentum, trend direction, candle pressure, and overall market bias, the indicator provides high-probability setups with excellent risk/reward potential.

