Auto Trend Lines Indicator: A Comprehensive Review
The Auto Trend Lines indicator is a popular technical analysis tool used by traders to quickly identify and plot trendlines on charts. This indicator automates the manual process of drawing trendlines, saving traders time while enhancing the accuracy of trendline placement. In this comprehensive review, we will cover everything you need to know about the Auto Trend Lines indicator, including how it works, its key features, pros and cons, and various trading strategies you can implement using this tool.
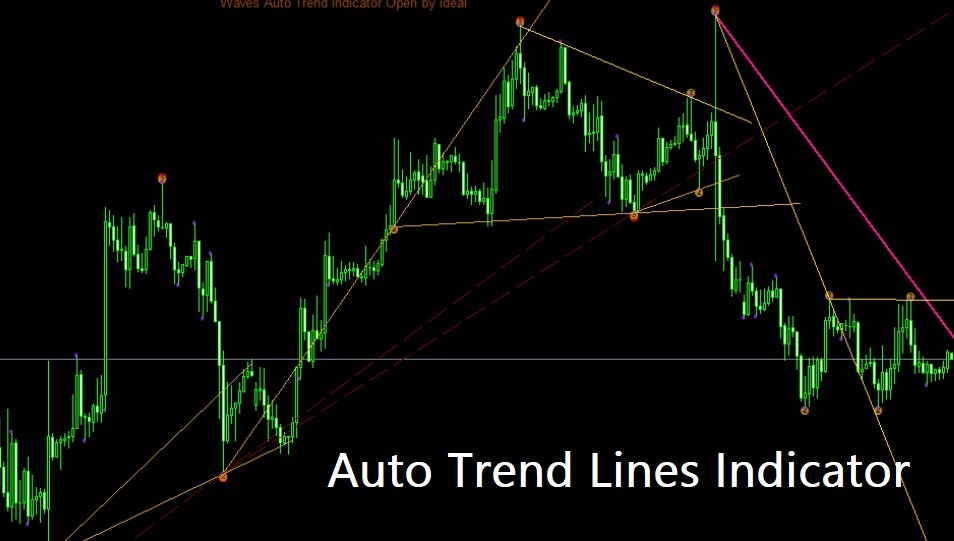
Download Free Auto Trend Lines Indicator
What is the Auto Trend Lines Indicator?
The Auto Trend Lines indicator is a custom indicator available for the MetaTrader 4 and MetaTrader 5 trading platforms. It utilizes advanced algorithms to detect swing highs and lows in price data, then plots significant trendlines connecting these pivot points automatically.
Unlike manually drawing trendlines which can be subjective, the Auto Trend Lines indicator provides an objective, rules-based approach to trendline plotting. This eliminates bias and human error from trendline analysis, resulting in more accurate trendlines that reflect current market conditions.
Some key features of the Auto Trend Lines indicator include:
- Automatically detects swing highs and lows based on user-defined parameters
- Draws uptrend lines connecting higher lows and downtrend lines connecting lower highs
- Extends projected rays of each trendline into the future
- Adjusts trendline positioning dynamically when new pivot points are formed
- Removes outdated trendlines when a trend reversal occurs
- Customizable settings and flexible usage across timeframes and symbols
Overall, the Auto Trend Lines indicator aims to improve trendline accuracy and save time by automating the subjective process of manual trendline drawing. This allows traders to quickly identify key levels of support and resistance using objective trendlines.
How the Auto Trend Lines Indicator Works
The Auto Trend Lines indicator uses a mathematical formula along with filtering mechanisms to plot only the most relevant trendlines on a chart. Here is an overview of how the indicator works:
- Locates potential trendlines – The indicator first identifies all possible trendlines that could be drawn, based on swing highs and lows over a user-defined lookback period.
- Filters trendlines – It then applies filters to eliminate irrelevant trendlines, removing lines with weaker slope strength and significance. This leaves only the top 1-2% most relevant trendlines.
- Plots filtered trendlines – The filtered subset of trendlines is plotted on the chart, with solid lines representing current trendlines and dotted lines showing projected rays.
- Adjusts in real-time – As new price data emerges, the indicator dynamically adjusts the trendline positioning and angles in real-time. Outdated trendlines are removed when a trend reversal occurs.
- Minimizes clutter – By filtering out less useful trendlines and removing outdated ones, the indicator presents high-quality trendlines without overcrowding the chart.
The end result is an automated trendline plotting process that reflects current market conditions accurately by responding to price dynamics in real-time.
Key Features and Settings
The Auto Trend Lines indicator has several customizable settings and options that traders can tweak to suit their preferences:
- Trendline lookback period – Adjusts how many bars are analyzed to detect swing points and plot trendlines. A higher value plots longer-term trendlines.
- Trendline projection length – Sets the length of the projected ray of each trendline extended into the future.
- Trendline color scheme – Allows changing the colors of the uptrend and downtrend lines.
- Alert configuration – Enables alerts when price interacts with a trendline, such as on crosses or touches.
- Trendline filtering aggressiveness – Controls how selective the indicator is in filtering out weaker trendlines.
These settings allow traders to fine-tune the sensitivity, projection lengths, colors, and alerts of the plotted trendlines. More aggressive filtering results in cleaner charts with fewer but more significant trendlines.
Using the Auto Trend Lines Indicator for Trend Analysis
The Auto Trend Lines indicator can be a valuable tool for analyzing trends across markets and timeframes. Here are some ways traders can use the indicator for enhanced trend analysis:
- Determine trend direction – The angle of the plotted trendlines clearly highlights whether price is trending up or down. This helps traders quickly identify the prevailing trend.
- Find support and resistance – The trendlines serve as dynamic support and resistance levels that can signal potential turning points in price action.
- Identify reversals – When an uptrend line is broken, it often signals a shift to a downtrend. Breaks of key trendlines can forecast trend reversals.
- Analyze trend strength – The angle of the trendline shows the strength of the trend. Steeper angled trendlines reflect a stronger trend.
- Spot pullbacks – Temporary breaks in the trendline can signal normal pullbacks within the larger trend. Traders can use these as potential entry points.
- Confirm chart patterns – Trendlines are often used to confirm chart patterns. The indicator makes this process more precise.
By incorporating the Auto Trend Lines indicator into their analysis, traders have an objective tool to improve trend identification, spot reversals earlier, and make smarter trading decisions.
Trading Strategies Using the Auto Trend Lines Indicator
The Auto Trend Lines indicator can be incorporated into most trading strategies since trendlines are a universal analysis tool. Here are some example strategies that can utilize the indicator:
Trendline Breakout Strategy
This straightforward strategy involves looking for price to break above an uptrend line or below a downtrend line, which signals potential continuation of the trend. The Auto Trend Lines indicator plots these key breakout points objectively.
Entry: When price closes outside the trendline
Exit: Trail stop below swing high/low or profit target
Trendline Reversal Strategy
For this strategy, traders wait for a break of an uptrend line followed by a close below it, which signals a potential trend reversal. The Auto Trend Lines indicator helps spot these reversals accurately.
Entry: When price closes below uptrend line
Exit: Trail stop above swing high/low or profit target
Trendline Pullback Strategy
This involves entering pullbacks to a key trendline, in the direction of the trend. The indicator helps identify solid pullback entry points.
Entry: When price pulls back to uptrend line
Exit: Trail stop below swing high/low or profit target
These are just a few examples of how the precise trendlines plotted by the Auto Trend Lines indicator can be incorporated into trading strategies across any market or timeframe.
Pros and Cons of the Auto Trend Lines Indicator
Here are some key advantages and potential disadvantages to consider when using the Auto Trend Lines indicator:
Pros
- Automates tedious manual trendline drawing
- Provides objective, rules-based trendline plotting
- Responds dynamically to price action in real-time
- Reduces human bias and errors in analysis
- Saves time and enhances workflow efficiency
- Easy to set up and use with default settings
- Works across all symbols and timeframes
Cons
- Repaints occasionally to adjust trendline positioning
- Can plot too many trendlines if filtering is not aggressive enough
- Lagging since based on past price data
- Not a complete trading system on its own
- Does not consider fundamental factors
While the indicator has some drawbacks, its advantages of quickly identifying accurate trendlines that respond dynamically to price action make it a useful addition for most traders. Using prudent risk management is still essential when using the indicator.
Using the Auto Trend Lines Indicator Effectively
Here are some tips to use the Auto Trend Lines indicator effectively:
- Combine it with other analysis tools – Use the indicator alongside chart patterns, candlesticks, momentum oscillators, etc. to validate trading signals.
- Customize settings to suit your trading style – Aggressive filter settings for day trades, longer projections for swing trades.
- Focus on high probability trendline breaks – Not all breaks are created equal. Focus on breaks of well-tested trendlines.
- Consider risk/reward when entering trades – Entering on lower probability breakouts can result in being stopped out frequently.
- Use appropriate stop losses – Place stops beyond significant swing highs/lows to allow some wiggle room.
- Adjust settings on different timeframes – Larger lookback periods and projections on higher timeframes.
- Do not overcomplicate – The trendlines plotted are meant to simplify analysis, not overcrowd charts.
By customizing the indicator based on trading style, and using prudent entry and risk management methods, traders can harness the Auto Trend Lines indicator as an edge in their overall trading.
Conclusion
In summary, the Auto Trend Lines indicator is a valuable addition for traders looking to enhance their trend analysis and trading strategies. By automating the plotting of trendlines and dynamically adjusting them to price action in real-time, the indicator provides an objective method to identify trends, reversals, and support/resistance levels across all markets.
While the indicator has some limitations, such as repainting and lag, its advantages of quickly plotting accurate and unbiased trendlines make it a useful tool if used properly. Traders should customize its settings based on their trading timeframe and combine it with other analysis methods to validate trading signals.
Overall, implementing robust risk management is still essential when using the Auto Trend Lines indicator. But in the hands of a skilled trader, this tool can provide an added edge by improving trend identification and providing an objective process to highlight high-probability trading opportunities.

