RSI and TDI Alert Dashboard Indicator: A Powerful Trading Tool
The RSI and TDI Alert Dashboard indicator is a versatile trading tool that combines the Relative Strength Index (RSI) with the Traders Dynamic Index (TDI) into an easy-to-use dashboard. This indicator allows traders to monitor multiple timeframes and currency pairs for overbought and oversold conditions, providing trade signals and potential entry points.
Download Free RSI and TDI Alert Dashboard
How the RSI and TDI Alert Dashboard Works
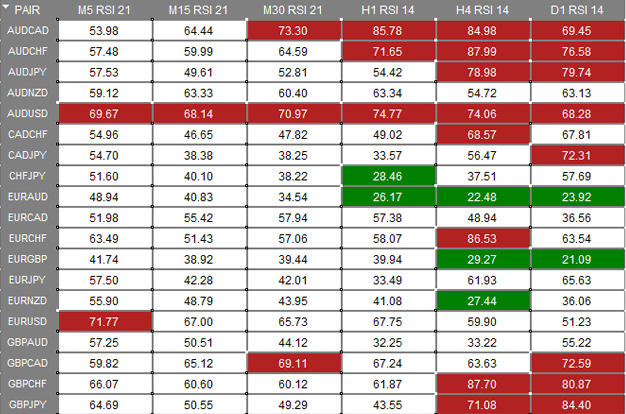
The dashboard displays six configurable RSI indicators, with customizable settings for time frame, RSI period, RSI type, overbought level, and oversold level. Traders can monitor the dashboard for alert signals when RSI reaches extended levels on the chosen timeframes and currency pairs.
The indicator offers two main uses:
- Multi-Timeframe Analysis: Monitor multiple timeframes (e.g. M5, M15, H1) for RSI extremes across one or more currency pairs. This shows when a pair has pushed too hard recently across timeframes, indicating an impending pullback or reversal.
- Single Timeframe with Multiple RSI Levels: Add several RSI indicators for a single timeframe to reveal the strength of the price extension. For example, monitoring the H4 timeframe with RSI periods of 10, 14, and 21. This helps identify exhaustion moves for mean reversion trades.
The dashboard also approximates the TDI indicator by allowing the RSI line to be set to the median price. This effectively recreates the TDI “signal line” for techniques like the shark fin pattern.
Key Features and Customization
The RSI and TDI Alert Dashboard includes the following key features:
- Alert Notifications – Get pop-up, email or push alerts when RSI levels reach extremes
- Summary Dashboard – View RSI status summaries for all configured timeframes and currency pairs
- Detailed RSI Settings – Customize time frame, RSI period, RSI type (e.g. close, median price), and overbought/oversold levels for each RSI instance
- Multiple Currency Pairs – Add all major, minor and exotic pairs to monitor
- TDI Approximation – Set one RSI to median price to emulate the TDI signal line
- Dashboard Size & Font Control – Adjust dashboard size and text size to your preferences
These customization options allow traders to fine tune the indicator to their trading approach, market conditions, and visual preferences.
Trading Strategies Using the Dashboard
The RSI and TDI Alert Dashboard can be incorporated into many short-term trading strategies, including:
Pullback Trades
Monitor for RSI overextensions on shorter timeframes (e.g. M5), then enter pullback trades when price corrects to value areas.
Reversals
Use multi-timeframe analysis to identify imminent reversals. If H4, H1 and M15 timeframes show overextended RSI readings, a reversal is likely.
Exhaustion Moves
When a single timeframe shows very over-stretched RSI levels across multiple periods (e.g. RSI 10, 14), it often signals an exhaustion move. Fade the price extreme.
TDI Shark Fin
Use median price RSI to identify TDI shark fin patterns. Enter on RSI signal line crossovers out of oversold/bought areas.
Breakout Continuation
If RSI is overextended on longer timeframes like H4, this indicates a strong trend. Trade pullbacks within the trend for high probability breakout continuations.
Using the Indicator Effectively
When using the RSI and TDI Alert Dashboard, keep these tips in mind:
- Use in combination with other analysis – Don’t rely solely on indicator signals
- Customize settings for your strategy and market conditions
- Monitor dashboard alerts for trade opportunities
- Practice sound risk and money management with any trades
- Be patient and wait for high probability setups
With its flexibility and customization options, the RSI and TDI Alert Dashboard can be a valuable addition to many short-term trading approaches. This versatile indicator provides trade signals while condensing market information into an easy-to-use visual format.
RSI and TDI Alert Dashboard Conclusion
The RSI and TDI Alert Dashboard for MT4 condenses multiple RSI indicators across various timeframes into an informative overview. Traders can use this dashboard for pullback trades, reversals, exhaustion moves, TDI shark fins, and more. With extensive customization options, traders can fine tune the indicator to suit their trading style. Used in combination with other analysis, the RSI and TDI Alert Dashboard provides high probability trade signals in an efficient dashboard format.

