Advanced Supply Demand Indicator Review
The Advanced Supply Demand Indicator is a technical analysis tool that aims to help traders identify potential support and resistance levels on charts. It does this by plotting zones of supply and demand based on price action and volume. This comprehensive review will analyze the key features, benefits, and potential drawbacks of using the Indicator for trading.
Download Free Advanced Supply Demand Indicator
Overview of the Advanced Supply Demand Indicator
The Advanced Supply Demand Indicator was created by developer Bernhard Schweigert and released on the MetaTrader Marketplace in February 2017. It has undergone several updates since then, with the latest version being 6.4 as of August 2022.
The indicator works by using an algorithm to scan historical price data and volume to identify zones on the chart where supply and demand imbalances have occurred in the past. It marks these areas on the chart as rectangular zones. Green zones indicate levels of demand where buyers stepped in, while red zones show areas of supply where sellers pushed price lower.
Some key features of the Advanced Supply Demand Indicator include:
- Plots historical supply and demand zones on the chart
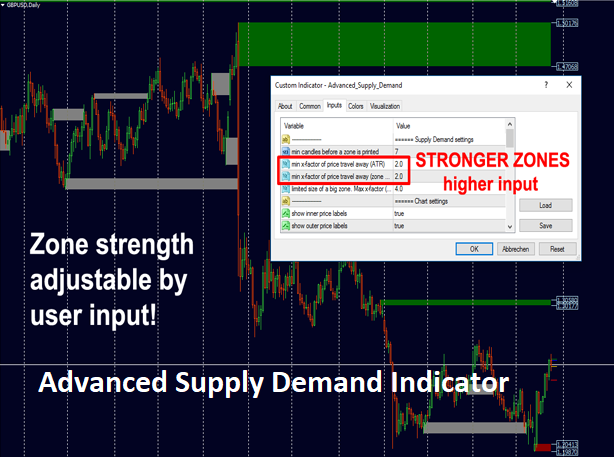
- Customizable zone strength settings
- Alerts when price approaches or enters a supply/demand zone
- Compatible with all symbols and timeframes on MT4
- Includes zone visuals for higher timeframes
How the Advanced Supply Demand Indicator Works
The Advanced Supply Demand Indicator has a complex algorithm working under the hood. Here is a brief overview of how it identifies supply and demand zones:
- Analyzes price swings, reversals, and volume surges to detect areas where imbalances occurred between buying and selling pressure.
- Further qualifies the strength of the zones based on parameters like the minimum price travel away from the zone, the size of the zone, and time elapsed since formation.
- Plots the most historically significant supply and demand zones on the chart as rectangular areas.
- Colors the zones based on age – newer zones are brighter while older zones fade.
- Allows viewing of supply/demand zones from higher timeframes on lower timeframe charts.
The indicator also has several configurable settings that let traders customize the appearance and alerts based on their preferences.
Using the Advanced SD Indicator for Trading
The Advanced Supply Demand Indicator can be useful for traders using technical analysis strategies like support and resistance trading. Here are some ways it can be utilized:
1. Identify Key Support and Resistance Levels
The indicator plots historical supply and demand zones that can act as support and resistance. Traders watch price action around these zones to time entries and exits.
2. Gauge Market Strength and Weakness
Strong buyer demand seen at a zone indicates bullish sentiment. Heavy selling supply shows bearishness. Traders can assess market conditions.
3. Anticipate Potential Reversals
Revisiting key zones previously marked by supply/demand imbalances hints at possible trend reversals.
4. Improve Risk Management
The zones serve as logical areas to place stop losses based on potential areas of support and resistance.
5. Trade Breakouts
Breaking out of supply or demand zones can lead to significant moves. Traders can trade the breakouts upon confirmation.
6. Confirmation for Other Strategies
The supply/demand zones can provide confirmation for strategies using indicators, price action, or chart patterns.
Benefits of Using the Indicator
Here are some of the notable benefits of using the Advanced Supply Demand Indicator:
- Provides chart clarity by visually marking key support and resistance areas.
- Zone strength algorithm qualifies only historically significant S/D levels.
- Customizable settings allow optimizing the indicator’s appearance and alerts.
- Suitable for all trading instruments across multiple timeframes.
- Alerts can be enabled to notify traders of trading opportunities near zones.
- Higher timeframe zones give broader market context to lower timeframe trading.
- Detailed user manual available explaining indicator settings and trading applications.
Potential Drawbacks of the Indicator
While the Advanced Supply Demand Indicator can be useful, traders should also consider a few potential limitations:
- Repainting issues – Like other indicators, repainting can occur on lower timeframes as new price data emerges.
- Too many zones – The algorithm may plot an excessive number of zones leading to chart clutter.
- Works best in ranging, non-trending markets – Trending moves can rapidly invalidate zones.
- Lagging – Old zones may become irrelevant so traders should focus on newer zones.
- Subjective – Traders may interpret and trade the zones differently based on their own bias.
- Divergences – Price may not always respect key zones leading to failed trades.
Verdict
Overall, the Advanced Supply Demand Indicator is a reasonably reliable and feature-rich tool for technically oriented traders. It excels at objectively identifying historical supply and demand zones on charts across all markets and timeframes.
However, traders need to apply discretion in selecting only the most significant zones to base trades on. The indicator output should be considered in the larger context of the prevailing trend and other technical factors. Effective implementation requires fine-tuning the parameters and combining the indicator with a defined trading strategy.
For traders already incorporating supply and demand analysis, the Advanced SD Indicator can serve as a beneficial confirmation tool. But it may have limited utility as a standalone indicator for novice traders.
Despite some drawbacks, the Advanced SD Indicator delivers value for traders focused on key support and resistance zones and willing to optimize its use as part of a broader trading plan.

