The Forex Pivot Lines Time Zone Indicator: A Comprehensive Review
The Forex Pivot Lines Time Zone Indicator is a powerful technical analysis tool that allows traders to customize their pivot points based on time zone. This indicator has become very popular among Forex traders for its ability to provide accurate support and resistance levels tailored to the trader’s specific needs. In this comprehensive review, we will explore how the indicator works, its key features and settings, how to use it effectively, and the pros and cons of this tool.
Download Free Forex Pivot Lines Time Zone Indicator
What is the Forex Pivot Lines Time Zone Indicator?
The Pivot Lines Time Zone Indicator is a customized version of the standard Pivot Point indicator found in most trading platforms. It works by allowing the trader to set the starting time used to calculate the pivot points based on their preferred time zone or trading session.
Standard pivot point indicators use the previous day’s high, low, and close prices to calculate the pivot levels. However, this may not align with the trader’s actual trading session. The Pivot Lines Time Zone Indicator solves this issue by letting users pick the starting time, allowing for more accurate pivots.
For example, a trader based in Australia trading the London session could set the indicator to use the open of the London session as the starting point rather than their local open or the previous day’s close.
How Does the Pivot Lines Time Zone Indicator Work?
The indicator works by first allowing the trader to set their desired time zone or session start time. It then detects the open, high, low, and close prices within that session to establish the pivot levels.
The standard pivot point (PP) is calculated as:
PP = (High + Low + Close) / 3
Additional resistance and support levels are calculated based on the PP:
R1 = (PP x 2) – Low
R2 = PP + (High – Low) R3 = High + 2 x (PP – Low)
S1 = (PP x 2) – High S2 = PP – (High – Low) S3 = Low – 2 x (High – PP)
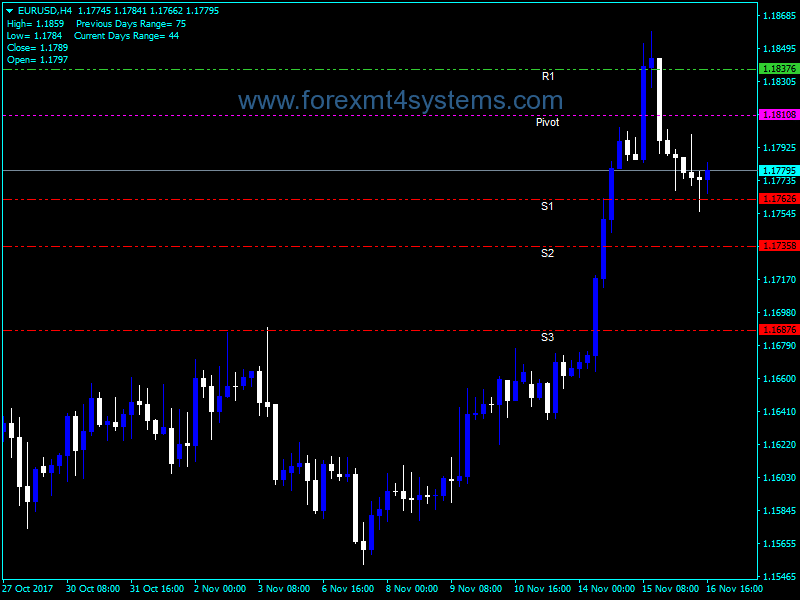
These levels are then plotted on the chart as horizontal lines. The indicator also has the option to plot mid-pivot points between the main PP line and R1/S1. It can also incorporate Camarilla pivots for more granularity.
Key Features and Settings
The Pivot Lines Time Zone Indicator includes several customizable settings:
- Time Zone Offset – Sets the hour offset from broker time to align with your desired trading session.
- Day Start Hour/Minute – Allows setting the specific open time rather than just an offset.
- Pivot Lines – Toggles display of main pivot points.
- Pivot Colors – Sets colors for each pivot line.
- Mid-Pivots – Toggles display of mid-pivot levels.
- Camarilla Pivots – Toggles display of Camarilla pivot levels.
- Pivot Buffers – Plots historical pivot points on the chart.
- Object Prefix – Customizes the prefix text for each pivot line.
These settings allow the trader to fully customize the indicator to their needs and trading approach. The ability to set specific session start times provides accuracy across various time zones.
How to Use the Pivot Lines Time Zone Indicator
Using the Pivot Lines Time Zone Indicator effectively requires following a few key steps:
- Determine your trading session – Decide if you are trading your local session, a major session like London or New York, or another custom time period.
- Set the indicator options – Input your desired time zone or custom start time in the indicator settings. Adjust other options like pivot line colors.
- Identify key levels – Look for price reaching the main PP line or the R1/S1 levels as key potential reversal points.
- Use additional confirmation – Combine the indicator with other analysis like candlestick patterns to confirm trades.
- Manage risk – Use stop losses and limit total risk per trade even with seemingly solid levels.
- Track results – Keep a trading journal to analyze performance and refine use of the indicator over time.
Following these tips will help optimize use of the tool for greater trading success. Don’t rely solely on the indicator, but use it as part of a complete trading plan.
The Benefits of Using the Pivot Lines Time Zone Indicator
Using the Pivot Lines Time Zone Indicator for MT4 offers traders several advantages:
- Customizable pivot levels – Matches pivots to your own trading session rather than a fixed time.
- Enhanced accuracy – More precise pivots improve odds of levels holding as support/resistance.
- Ease of use – Simple settings make it easy to set up with any session.
- Works on all timeframes – Can be used for both intraday and swing trading.
- Free indicator – Comes standard with MetaTrader so no purchase needed.
- Wide compatibility – Functions in both MT4 and MT5 trading platforms.
- Additional pivot options – Mid-pivots and Camarilla pivots provide more data points.
The flexibility and customization of the indicator are its biggest benefits. Traders can truly optimize it for their own needs.
Potential Drawbacks to the Indicator
While the Pivot Lines Time Zone Indicator can certainly enhance analysis, there are some potential limitations to consider:
- Not a standalone system – Works best combined with other indicators and analysis.
- Levels may not hold – Like all indicators, pivot points will be broken at times.
- Requires monitoring – Needs active adjustment if trading multiple sessions.
- Limited customization – Some traders may want even more complex pivot calculations.
- Can repaint – Changing time settings could redraw levels on chart.
- No major alerts – Must watch charts closely rather than relying on alerts.
The main drawback is the indicator should not be used as a complete trading system by itself. Use it as a confirmation tool within your broader strategy.
Using the Indicator for Day Trading vs Swing Trading
The Pivot Lines Time Zone Indicator can be used for both short-term day trading and longer-term swing trading. However, there are some differences in application:
- Timeframes – Use shorter timeframes like 5 or 15-minute charts for day trading, while swing trading benefits from hourly, 4-hour, or daily charts.
- Level monitoring – Day traders will watch price action around levels more closely in real-time compared to monitoring swings.
- Trend vs range – Day traders may trade counter-trend bounces more aggressively while swing traders adhere to the trend.
- Risk management – Intraday traders should use tighter stops and avoid overnight exposure.
- Session flexibility – Swing traders can keep a fixed session while day traders may change sessions.
In general, the indicator provides excellent structure for both short and long-term systematic traders if used prudently.
Combining the Indicator with Other Tools
While the Pivot Lines Time Zone Indicator delivers solid levels, combining it with other analysis and tools can further improve trading performance.
Some effective ways to use the indicator in combination include:
- Trend indicators – Use a moving average to gauge the trend direction on a given timeframe.
- Candlestick patterns – Look for reversals or continuations around levels to confirm trades.
- Momentum oscillators – Watch for divergences with RSI, MACD, or Stochastics at extremes.
- Fibonacci retracements – Draw Fib levels between swings to identify convergence with pivots.
- Price action – Trade pullbacks, breakouts, rejections, and other behaviors around levels.
- Volume – Look for increased volume on support or resistance tests.
Essentially any tool that helps confirm the strength of the pivot levels can add greater edge. The indicator becomes even more powerful when combined with sound analysis.
Optimizing the Indicator Settings
Optimizing use of the Pivot Lines Time Zone Indicator requires carefully testing and evaluating different settings over time. Follow these tips:
- Try various sessions – Test different timezone offsets to find the best fit.
- Check multiple timeframes – Look for settings that work across short and long-term charts.
- Assess win rates – Determine if trades at certain levels have a strong win percentage.
- Review stop distances – Look for optimal stop loss placement beyond levels.
- Log level touches – Keep notes on how price behaves at each line.
- Monitor daily changes – Adjust for holidays, daylight savings, or other session shifts.
Refine your use of the tool by tracking detailed performance statistics. This will help fine-tune the settings and usage for your particular trading style.
Top Tips for Using the Indicator Successfully
Here are some key tips for getting the most out of using the Pivot Lines Time Zone Indicator:
- Use it in combination with other indicators and analysis methods rather than relying solely on the pivots.
- Be flexible and adjust the indicator’s settings periodically to optimize it as market conditions change.
- Focus on the most important levels like the main PP line and R1/S1 areas for simplicity.
- Look for confirmation from price action behavior like rejections or breakouts around levels.
- Be patient and wait for trades at key levels rather than forcing questionable trades.
- Manage risk properly on every trade using stop losses and appropriate position sizing.
- Track your trading stats to refine when and how you use the indicator over time.
Following these tips will help improve your odds of success.
Conclusion
The Pivot Lines Time Zone Indicator provides traders with a customizable tool to establish accurate support and resistance levels tailored to their specific trading session and style. The indicator offers much flexibility through its various settings options and can be combined with other analysis methods for greater edge. While the tool has some limitations, it can be optimized and incorporated into a complete trading plan to enhance strategy performance. Overall, the Pivot Lines Time Zone Indicator is an excellent free indicator option for traders looking to boost their technical analysis arsenal.

