Understanding and Using the Forex Average Daily Range Indicator for Improved Trading
The Forex Average Daily Range Indicator is a useful technical analysis tool for Forex traders. It measures the average pip movement between the daily high and low prices of a currency pair over a specified lookback period.
The ADR indicator provides valuable insights into the volatility and liquidity conditions of the market. Traders can use the ADR to guide their trade entry and exit points, set stop losses, and identify potential breakout trading opportunities.
Download Free Forex Average Daily Range Indicator
What is the Forex Average Daily Range (ADR) Indicator?
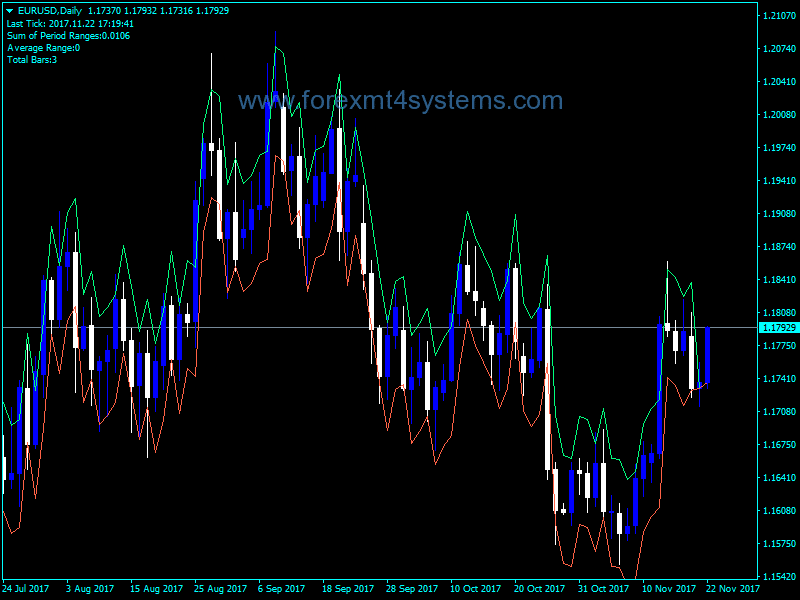
The Average Daily Range indicator for MT4 calculates and plots the average daily trading range over a set period of time. The daily range refers to the difference between the high and low prices of each trading day.
For example, if EUR/USD traded between 1.1200 (high) and 1.1000 (low) on a particular day, the daily range would be 200 pips (1.1200 – 1.1000).
The ADR indicator takes the daily ranges over a lookback period, sums them, and divides them by the number of days to derive the average. For instance, if the sum of the 14-day EUR/USD daily ranges is 2000 pips, the 14-day ADR would be:
2000 pips / 14 days = 142.9 pips
The standard setting is to calculate the ADR based on the past 14 days. But traders can adjust the lookback period to suit their trading style and market conditions.
Key Benefits of the ADR Indicator
There are several advantages to using the Average Daily Range indicator in Forex trading:
1. Gauge Volatility and Liquidity Conditions
The ADR shows at a glance how volatile and liquid the market has been over a period of time. A higher ADR means the market has been moving more, while a lower ADR suggests tighter daily ranges and calmer conditions.
2. Inform Entry and Exit Levels
Traders can use the ADR to determine suitable points to enter or exit trades based on historical volatility. For instance, they may choose to avoid trades when the price exceeds the typical ADR range.
3. Set Stop Losses
The ADR can guide effective stop loss placement. By using the ADR value as a guide, traders can set stop levels that allow room for normal market fluctuations.
4. Spot Breakout Opportunities
When the market begins pushing the extremes of the ADR, it often represents increased momentum. Savvy traders will watch for breakouts beyond the ADR to join emerging trends early.
How to Calculate the Forex ADR
The Average Daily Range calculation process is straightforward:
- Select the currency pair
- Set the number of days for the lookback period (e.g. 14 days)
- For each day in the period, subtract the low from the high to get the daily range
- Sum the daily ranges over the entire period
- Divide the sum by total number of days
The result is the average pip movement per day over the lookback period – or the Average Daily Range.
While traders can perform this calculation manually, most trading platforms have a built-in ADR indicator that does the math automatically. The indicator plots a horizontal line at the ADR level and shows the value in the window.
How to Use the ADR Indicator in Forex Trading
Now that we understand what the Average Daily Range indicator does, let’s discuss some practical examples of how traders use it to improve analysis and decisions:
Identify Volatility Conditions
Analyze the current ADR value to determine if volatility is currently low, normal or high compared to the historical norm. For example, if the 14-day ADR on EUR/USD is 120 pips, but the market recently pushed to 170 pips in a day, traders would recognize volatility is elevated.
Confirm Trade Signals
Look for trade signals that align with the ADR to improve confidence. For instance, if a bullish engulfing pattern forms close to the upper ADR level, it may signal an emerging uptrend.
Avoid Exhaustion Moves
When the price stretches well beyond the ADR, it often represents an exhaustion point. Savvy traders will avoid new positions when significantly exceeding the typical daily range.
Set Profit Targets
The ADR can provide guidance on sensible profit targets. For example, traders may look to take partial profits or use a trailing stop around the outer ADR level.
Trail Stops
Stop levels can trail price action at a distance approximately equal to the ADR. This technique allows room for normal fluctuations while locking in profits.
Modifying the ADR Lookback Period
The standard ADR setting is 14 days. But traders can adjust this lookback period to better match their trading timeframe:
| Timeframe | Suggested ADR Lookback Period |
|---|---|
| Scalping | 5 days |
| Day Trading | 10 days |
| Swing Trading | 20 days |
| Position Trading | 30+ days |
For example, swing traders holding positions for days or weeks at a time may wish to see the average range over longer periods like 30-50 days. The expanded period gives a better sense of price fluctuations over their typical holding period.
Intraday scalpers, on the other hand, may set the ADR to 5 days or less. The shorter historical sample focuses on the price action relevant to their trading session.
Combining ADR with Other Indicators
While the Average Daily Range indicator delivers value on its own, traders can amplify performance by combining it with other analysis tools like:
ADR + Moving Averages
Plot moving averages on the chart to show the trend direction and use ADR to time entries. For example, look for pullbacks to the 20-period moving average near the ADR extremes to join trends.
ADR + MACD
The Moving Average Convergence Divergence oscillator can reveal momentum shifts. Watch for MACD crossovers when the price pushes ADR boundaries for high probability trades.
ADR + RSI
Overbought and oversold readings from the Relative Strength Index help identify exhaustion moves. Consider ADR-RSI combo signals – like an RSI above 70 and price stretching above the ADR – for reversion trades.
ADR + Fibonacci Retracements
Plot Fibonacci retracements on recent swings to highlight support and resistance levels. When these Fib levels align with ADR extremes, it signals high quality trade location.
By combining indicators that reveal overarching trend, momentum shifts, and extremes in volatility, traders can spot high-probability ADR setups.
Pros and Cons of the Average Daily Range Indicator
Below are some key benefits and drawbacks traders should consider when using the ADR indicator:
Pros
- Simple interpretation and calculation
- Determines current volatility conditions
- Helps set entry levels, stop losses and targets
- Spots exhaustion moves and breakouts
Cons
- Lagging – based on historical data
- Different lookback periods suit different trading timeframes
- Works best with other indicators for confirmation
While the ADR has some disadvantages, it remains an invaluable tool for Forex traders. The indicator quantifies volatility, guides risk management, and boosts the odds of successful trades when used judiciously in a trading plan.
Forex Average Daily Range Indicator Conclusion
The Average Daily Range measures typical daily volatility in Forex pairs to improve trading decisions. By revealing high and low volatility regimes, traders can match positions size to market conditions. Monitoring the ADR also helps determine prudent entry and exit levels while avoiding exhaustion moves at extremes.
Savvy traders use the Average Daily Range indicator in conjunction with other analysis tools like moving averages, oscillators and Fibonacci levels. The ADR works for any trading timeframe from scalping to long-term positioning. While past volatility doesn’t guarantee future returns, the ADR remains an indispensable component of a well-rounded Forex trading strategy.

