Forex Kagi Charts Indicator
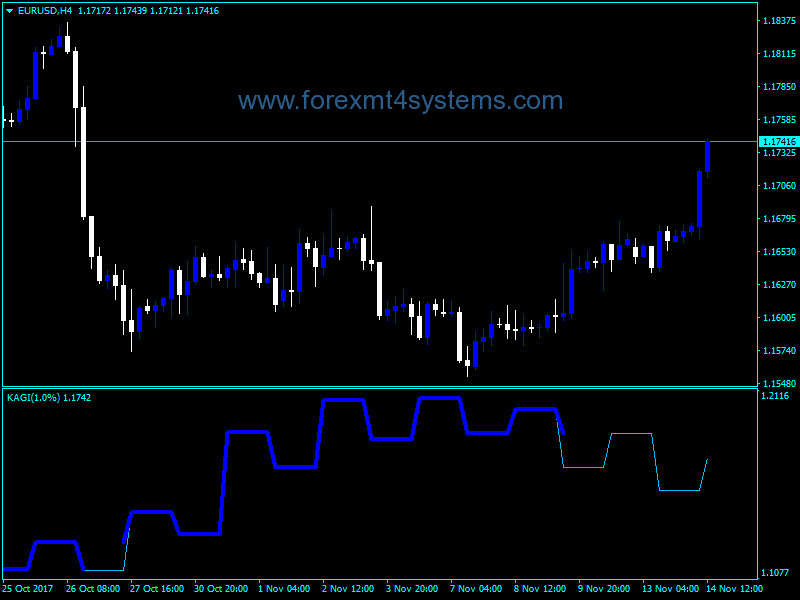
Forex Kagi Charts Indicator are supposed to appear in 70s of the 20th century, at the first stage of Japanese stock market development. The Kagi Charts represent a series of interconnected vertical lines. The thickness and increment direction of these lines are determined by the price dynamics. The Kagi Charts do not consider the time.
If price move on in the same direction, the vertical line in the chart becomes longer. If the price turns by a pre-defined value (reverse coefficient), a new vertical line in a new column will be drawn in the chart. The thickness of Kagi lines changes when prices exceed their previous maximum/minimum values.
The Kagi Charts became known in the USA due to Steve Nison’s book named “Beyond Candlesticks”.
The Kagi Charts illustrate how demand-and-supply forces act. A sequence of thick lines speaks for that the demand is above supply (the market grows).
A sequence of thin lines means that the supply is above demand (the market drops). Interchange of thick and thin lines speaks for that the market is balanced (supply is equal to demand).
The basic trade signal on a Kagi chart is the line thickness: If a thin line becomes thick, you should buy, if vice versa, you should sell.
A sequence of increasing maximums and minimums speaks for the power of the ascending movement, decreasing maximums and minimums speak for the weak market.
Parameters
Porog – reversing coefficient in percents
What does Forex Indicator mean?
A forex indicator is a statistical tool that currency traders use to make judgements about the direction of a currency pair’s price action. Forex indicators come in many types, including leading indicators, lagging indicators, confirming indicators and so on. Popular forex indicators include moving averages, relative strength index (RSI) and average true range (ATR). A forex trader must choose the indicators that fit his or her trading strategy.
How to install Forex Kagi Charts Indicator?
- Download Forex Kagi Charts Indicator.zip
- Copy mq4 and ex4 files to your Metatrader Directory / experts / indicators /
- Copy tpl file (Template) to your Metatrader Directory / templates /
- Start or restart your Metatrader Client
- Select Chart and Timeframe where you want to test your forex indicator
- Load indicator on your chart
How to uninstall Forex Kagi Charts Indicator?
To shut down an indicator, one has to remove it from the chart. At that, its drawing and recalculation of its values will stop. To remove an indicator from the chart, one has to execute its context menu commands of “Delete Indicator” or “Delete Indicator Window”, or the chart context menu command of “Indicators List – Delete”.

