Forex Market Profile Indicator: A Comprehensive Review
The Forex Market Profile indicator is a powerful technical analysis tool that displays a visual representation of price action, volume, and time. It provides traders with an in-depth perspective into market dynamics that is not apparent on standard candlestick charts. In this comprehensive review, we will cover everything you need to know about using the Market Profile indicator for trading success.
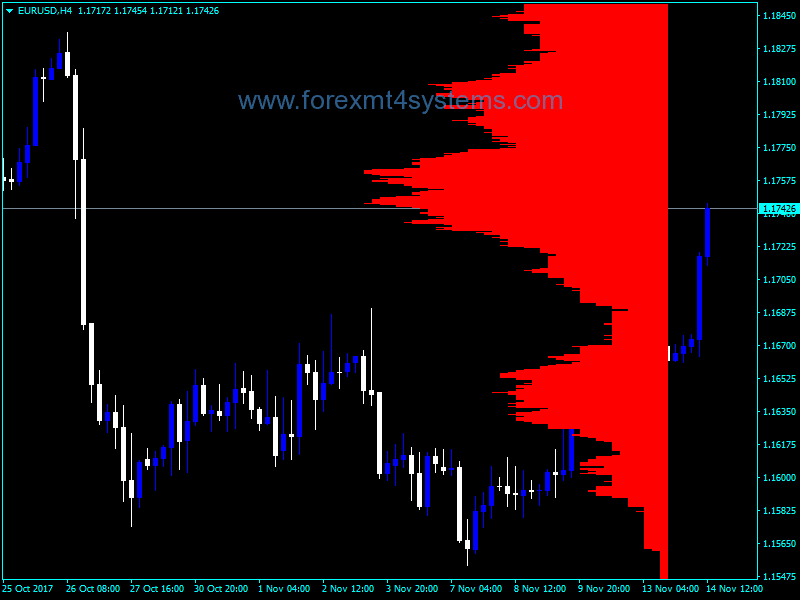
Download Free Forex Market Profile Indicator
What is the Market Profile Indicator?
The Market Profile indicator was originally conceptualized by J. Peter Steidlmayer at the Chicago Board of Trade (CBOT) in the 1980s. It aims to identify value areas, key support and resistance levels, and areas of high and low volume based on the market’s price action over a specified time period.
Unlike other technical indicators that mainly focus on price and volume, the Market Profile also incorporates the element of time into its analysis. It displays a histogram of price levels on the y-axis, time periods on the x-axis, and volume at each price level through the width of bars on the histogram.
Together, these three dimensions provide a unique perspective into the developing market structure and sentiment. The Market Profile transforms raw price data into an insightful graphical representation that reveals the underlying market auction process.
Key Elements of the Market Profile
There are several key elements that make up the Market Profile indicator:
- Value Area (VA) – The value area represents the price range that contains a specified percentage of all trading activity, usually 70%. It highlights the area where the market has found equilibrium between buyers and sellers.
- Point of Control (POC) – The point of control is the single price level within the value area with the highest volume and trading activity. It indicates the fairest price agreed upon by market participants.
- High Value (HV) – The high value is the highest traded price within the value area range. It acts as resistance.
- Low Value (LV) – The low value is the lowest traded price within the value area range. It acts as support.
- Profile Shape – The overall shape of the Market Profile provides insights into market sentiment. Certain shapes can identify trends or periods of balance/imbalance.
- Time – The Market Profile arranges price action into set time intervals, allowing traders to identify market activity at different times of day.
How to Read and Interpret the Market Profile
Learning to properly read and interpret the Market Profile indicator takes considerable practice, but doing so can significantly improve trading decisions. Here are some key points of analysis:
- Look at the value area, POC, HV, and LV to identify key support and resistance levels, as well as fair value prices. Expect the price to return to these levels.
- Analyze the developing profile shape and volume levels. This can reveal periods of directional conviction or balance in the market.
- Pay attention to whether the current price is trading inside or outside of the value area. This shows if the market is in balance or imbalance.
- Monitor the location of the POC compared to prior days. This can indicate overall shifts in market sentiment.
- A wide, even profile shape signals a balanced market. A tapered shape on one side indicates directional conviction.
- Volume levels show acceptance (high volume) or rejection (low volume) of prices. High volume areas tend to act as support and resistance.
Trading Strategies Using the Market Profile
The Market Profile indicator opens up many possibilities for crafting trading strategies across various markets and timeframes. Here are some examples:
Range Trading
Range trading involves buying near support and selling near resistance. The value area, HV, and LV levels provided by the Market Profile are ideal for identifying potential support and resistance levels to trade from.
Breakouts
Monitoring volume levels can help traders anticipate potential breakouts. Low volume areas highlight prices that were rejected. Breaking above or below these areas with increased volume signals a potential breakout.
Pullbacks
The Market Profile identifies value areas and POC levels where pullbacks are likely to occur. Traders can buy pullbacks near support or sell rallies near resistance.
Intraday Pivots
Shifts in intraday POC levels can be used to identify intraday pivots in market direction. As the POC rises, it signals upward momentum is accelerating.
Value Area Fades
When price stretches far above or below the value area, it presents fade trading opportunities back towards fair value.
Benefits of Using the Market Profile
Here are some of the key benefits and advantages of using the Market Profile indicator:
- Provides a visual representation of market activity across price, time, and volume.
- Identifies key support, resistance, and value areas.
- Reveals periods of directional conviction and balance in the market.
- Allows traders to objectively define market value and sentiment.
- Spots low volume rejection areas and high volume acceptance areas.
- Can be applied across any market or timeframe.
- Simplifies analysis compared to complex indicators with many inputs.
- Works well with other indicators and analysis techniques.
Limitations of the Market Profile
Despite its advantages, the Market Profile also has some limitations to consider:
- It takes time and practice to learn to read and interpret it effectively.
- Works best with reasonable daily trading ranges and volume. Volatile or low volume environments can distort the profile shape.
- Requires consistent time periods and brackets to form comparable profiles across multiple days. Intraday profiles may have limited relevance.
- Does not generate direct trading signals. It still requires analysis and interpretation.
- Focuses solely on price action, time, and volume. Does not incorporate other data.
- Drawing accurate profiles requires quality price and volume data. Poor data can distort profiles.
Using the Market Profile MT4 Indicator in Forex Trading
While the Market Profile was originally designed for futures markets, it can also be applied successfully to forex trading with some adaptations:
- Use major forex trading sessions (London, New York, Tokyo) as the time brackets rather than exchange trading hours.
- Apply the indicator to currency pairs with adequate liquidity and daily ranges. More liquid pairs like EUR/USD generate better defined profiles.
- Longer timeframes above H4 are recommended. Intraday forex profiles may have limited relevance due to 24-hour trading.
- Be aware of major news events that cause volatility spikes. This can distort the profiles.
- Define value areas based on daily or weekly profiles. Intraday value areas are less significant due to constant forex trading.
- Use with other indicators. Relying solely on the Market Profile is not recommended for forex trading.
Forex Market Profile Indicator Conclusion
The Market Profile is an invaluable indicator that reveals the underlying dynamics between price, time, and volume in any market. It transforms raw price data into a graphical representation that provides insights not available on standard candlestick charts. Traders who take the time to learn to properly read and interpret the Market Profile will gain a huge advantage in their analysis.
However, the Market Profile has limitations. It still requires careful analysis and works best when combined with other indicators or analysis techniques. Overall, integrating the Market Profile into your trading can significantly enhance your market understanding, identify trading opportunities, and improve your forex trading results.

