Understanding the ADR Reversal Indicator
The ADR Reversal Indicator is a powerful technical analysis tool that can give traders an edge in identifying potential trend reversals. ADR stands for Average Daily Range, which refers to the average pip movement of a currency pair over a specified lookback period. The indicator plots the average daily high and low on the chart and sends alerts when price exceeds these levels. Let’s dive into how the ADR Reversal Indicator works and how traders can effectively utilize it in their trading.
Download Free ADR Reversal Indicator
What is Average Daily Range?
Average Daily Range (ADR) measures the average pip range between the daily high and low of a currency pair over a set lookback period, typically 10 days or 21 days. For example, if EUR/USD had the following daily ranges over 10 days:
Day 1: 30 pips Day 2: 50 pips Day 3: 20 pips Day 4: 40 pips Day 5: 60 pips Day 6: 35 pips Day 7: 45 pips Day 8: 55 pips Day 9: 25 pips Day 10: 15 pips
The 10-day ADR would be (30 + 50 + 20 + 40 + 60 + 35 + 45 + 55 + 25 + 15) / 10 = 375/10 = 37.5 pips
The ADR establishes the average expected daily volatility and range for the currency pair. Traders can then look for price exceeding the average range as a sign of increased momentum and a potential reversal.
How the ADR Reversal Indicator Works
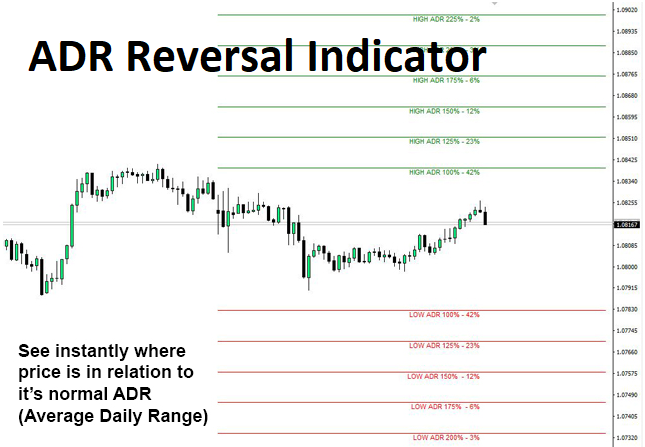
The ADR Reversal Indicator plots horizontal lines on the chart at the ADR high and low levels, providing a visual range of the expected daily volatility.
For example, if the 10-day ADR is 50 pips, the indicator will plot a horizontal line 50 pips above and below the current price to mark the average high and low range.
The indicator also sends pop-up, email or push alerts when price breaks out above or below the ADR levels. This allows traders to get real-time notifications when volatility expands beyond the norm.
Exceeding the ADR can signal a potential trend reversal, especially if price breaks the ADR after an extended move. Traders can look to enter pullbacks after price exceeds the ADR extremes.
Trading with the ADR Reversal Indicator
The ADR Reversal Indicator can be incorporated into most trading strategies for additional confirmation and to help target entries. Here are some ways traders can effectively utilize the indicator:
- Fade breakouts – When price exceeds the ADR extreme, traders can look to fade the breakout and enter pullbacks back within the ADR range. This reversal strategy aims to capture moves back to the mean.
- Confirm trend exhaustion – If price breaks the ADR level after an extended trend move, it can signal trend exhaustion. Traders can watch for a reversal pattern to form before entering in the new trend direction.
- Gauge volatility – Monitoring if price is trading near, within or exceeding the ADR range gives a perspective on volatility. Low ADR days present range trading opportunities, while high ADR days can capture bigger breakouts.
- Define exit points – The ADR levels can act as profit targets. Traders may opt to close positions or tighten stops when price reaches the ADR extremes.
Optimizing the ADR Reversal Indicator
The ADR indicator for MT4 can be customized to suit different trading styles and markets. Some ways to optimize the indicator include:
- ADR Period – The standard setting is 10 or 21 days. Higher periods smooth the average while lower periods make it more sensitive. Test different periods on the currency pair.
- ADR Bands – Add additional bands above or below the ADR for extended target levels. For example, plot 150% and 200% of ADR.
- Alert Method – Choose pop-up, email or push alerts based on your preference for receiving notifications.
- Alert Levels – Customize which ADR levels will trigger alerts, for example only when price exceeds 200% of ADR.
- Time Frames – Add the ADR indicator to higher time frames like 4H or daily to define larger ranges and reversal zones.
Combining the ADR Indicator with Other Analysis
For highest probability setups, traders should combine the ADR with other confluent factors. Some complementary analysis includes:
- Price action – Look for reversal candlestick patterns or momentum divergences to confirm an ADR breakout.
- Volume – Increased volatility on expanding volume validates the ADR breakout.
- Oscillators – Overbought/oversold readings like RSI can signal exhaustion after an ADR break.
- Moving averages – The ADR levels aligning with moving average support/resistance boosts significance.
- Trend lines – Existing trend line breaks, channels or chart patterns aligning with ADR breakouts improves odds.
By combining the ADR indicator with additional confirmation, traders can effectively identify high probability trend reversal setups. Integrating the analysis above allows traders to maximize the edge gained from this versatile technical indicator.
Conclusion
The ADR Reversal Indicator provides a statistically-derived range representing average daily volatility. Monitoring price breaks beyond the ADR extremities can alert traders to increased momentum and potential trend reversals. Traders can customize the indicator based on the currency pair, time frame and trading style. The ADR works best when combined with other analysis for maximum effectiveness. Overall, the ADR Reversal Indicator is a valuable addition to every trader’s charting toolbox to improve timing and precision in trading trend reversals.

