
ADF Stationarity Pulse is a stationarity indicator TradingView traders can use to test the assumption before they act on it. Also, fading a stretched market only makes sense if the series pulls back to a mean at all. This script runs an Augmented Dickey-Fuller regression on the last 40 closes, plots the resulting t-statistic in its own pane, and compares it to the 5% critical value of -2.86.
It is free and open source. Indeed, you can add it to any chart from the ADF Stationarity Pulse script page on TradingView, and the full Pine source is published there for you to read.
What ADF Stationarity Pulse plots in a separate pane below price
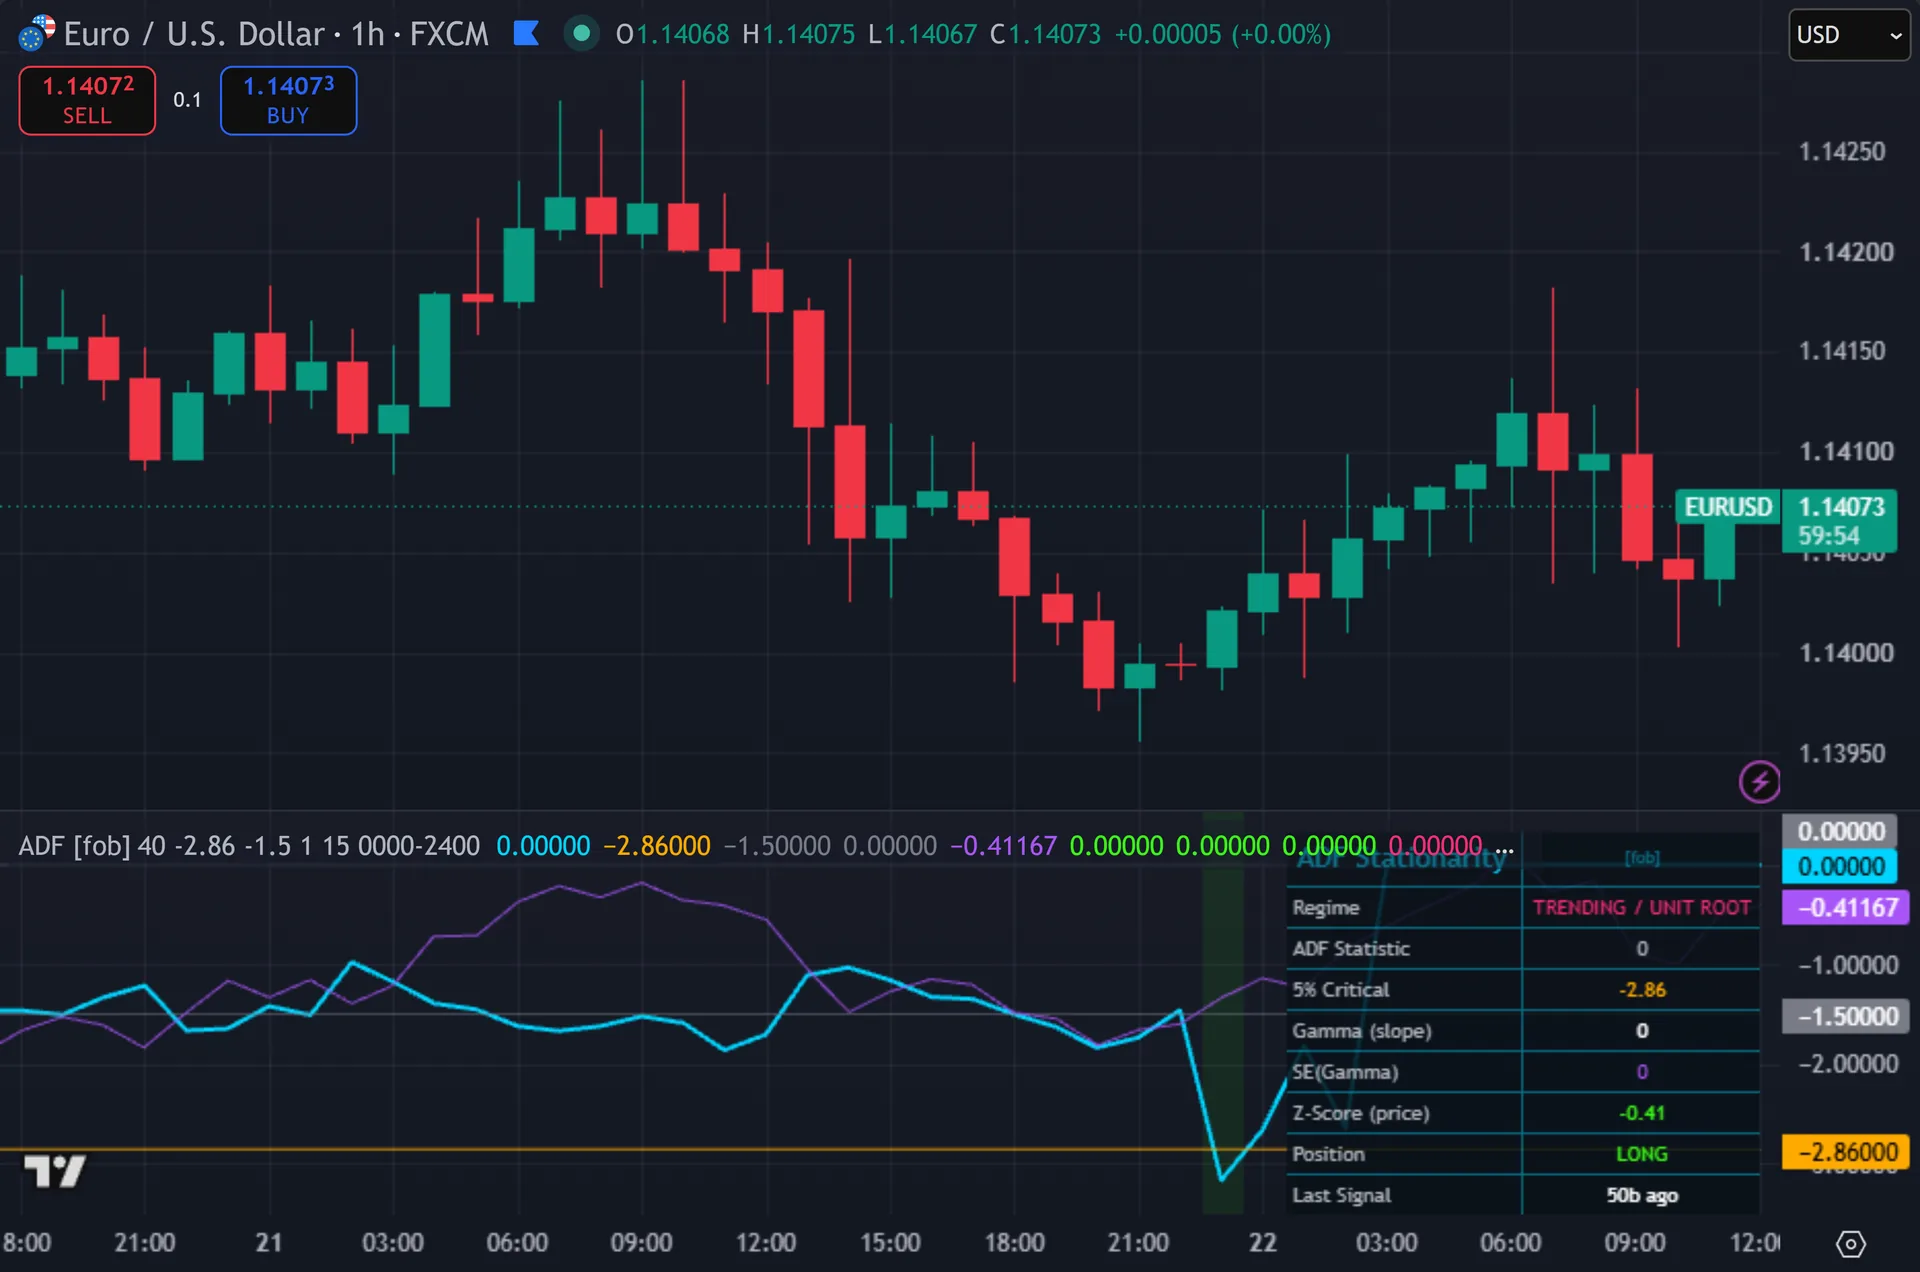
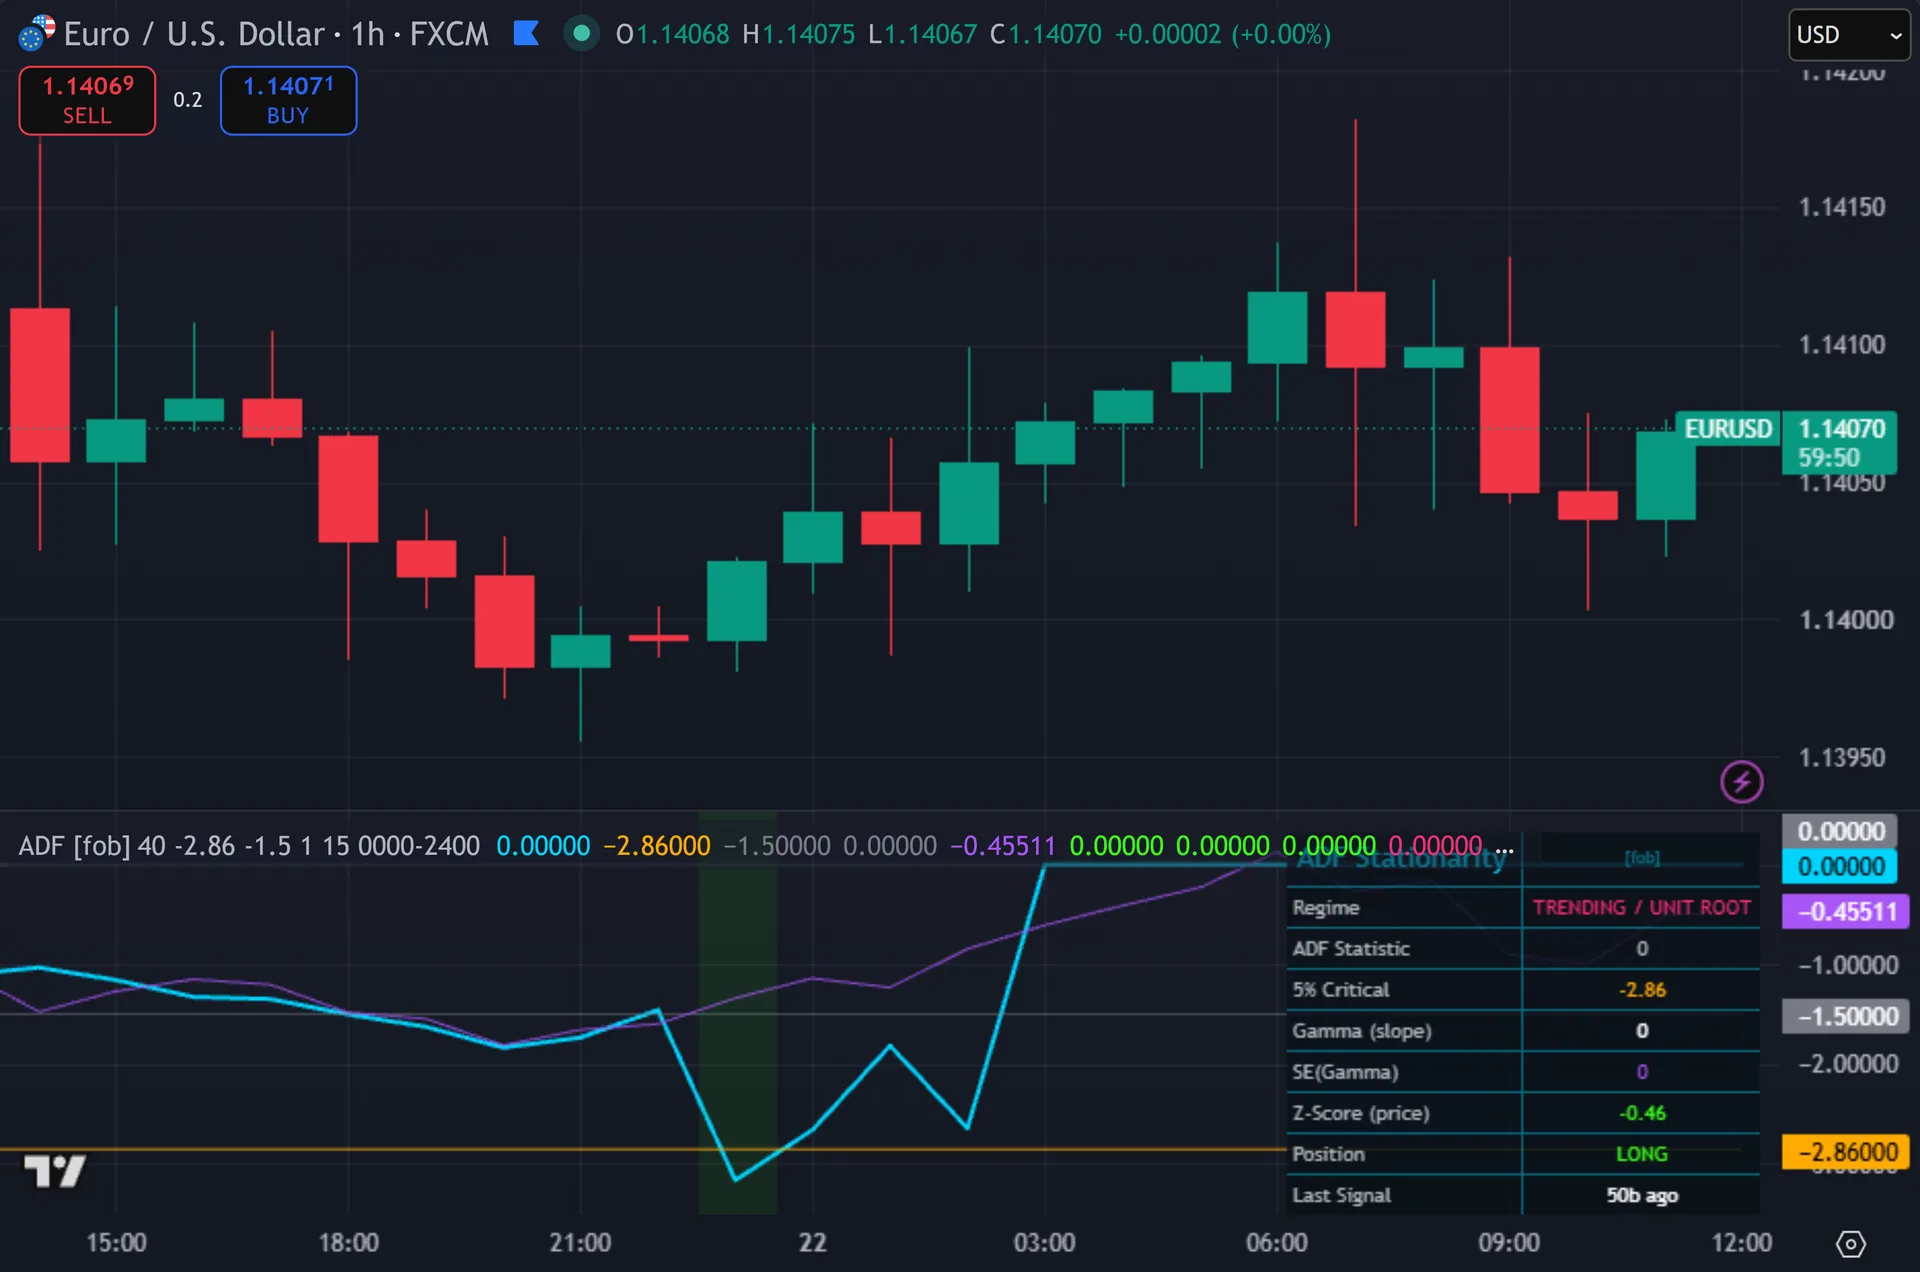
The indicator sits in a separate pane under price. Still, a cyan line plots the ADF statistic bar by bar. A gold line marks the -2.86 critical value, a grey line marks the -1.5 warning level, and a third grey line marks zero. Thus, a purple line plots the z-score of price against its own 40-bar mean. The pane background turns faint green while the statistic sits under the critical value. Hence, signals print as circles at the bottom or top of the pane with the text ADF. A nine-row dashboard reports regime, the statistic, the critical value, gamma, the standard error of gamma, z-score, position and bars since the last signal.
How ADF Stationarity Pulse is built
A real ADF regression, not a proxy
The script fits an actual regression rather than approximating one. Next, the model is the standard augmented form: the change in price equals a constant, plus gamma times the previous price, plus beta times the previous change, plus an error term. It runs that fit over the last 40 closes, which the ADF Window input controls.
The solution is closed form. Then, the code accumulates the cross-sums in a single loop, centres each variable so the constant drops out, then solves the two-variable normal equations directly. From there it computes the residual sum of squares, divides by n minus 3 degrees of freedom, and derives the standard error of gamma from the inverse matrix term. Yet, the ADF statistic is gamma divided by that standard error. The dashboard shows both parts, so you can inspect the regression instead of trusting a black box.
Two honest caveats belong here. Truly, the regression carries exactly one lagged difference, so it is an ADF with one lag and no automatic lag-length search. And the critical value is a hard-coded constant of -2.86, which is the asymptotic 5% level for the with-constant case. Plainly, a 40-observation sample really calls for a slightly stricter number nearer -2.93, so the shipped setting reads a touch permissive. The input stays editable.
From regime to signal
The statistic answers one question: does this window look mean-reverting or does it look like a random walk? Also, a value under -2.86 rejects the unit root at the 5% level, and the script calls that regime MEAN-REVERTING and tints the pane green. Between -2.86 and -1.5 it reports WEAK MR. Indeed, above -1.5 it reports TRENDING / UNIT ROOT.
Stretch comes from a second, separate measure. Still, the script takes the 40-period simple moving average and the 40-period standard deviation of close, then computes the z-score of the current close against them. Z-Score Threshold defaults to 1.0, so price must sit at least one deviation from its own mean.
A long needs both conditions together: a stationary regime and a z-score under -1.0. Thus, a short needs the same regime with a z-score above 1.0. Three gates follow. Hence, the bar must close, since the code requires barstate.isconfirmed. At least 15 bars must have passed since the last signal. Next, and the internal position state forces buys and sells to alternate. An optional session filter ships wide open. Then, the pane stays flat until the chart holds at least 42 bars, since the regression needs the window plus two extra lags.
How to read the signals
Read the cyan line against the gold one first. Yet, below gold, the window rejects the unit root and mean reversion has statistical support. Above gold, it does not, and any fade you take runs without that support. Truly, many traders use the line purely as a context filter and take entries from another tool.
The purple z-score line tells you where price sits, not where the regime sits. Those two answer different questions. A deeply negative z-score during a TRENDING reading describes a market that is stretched and staying stretched. Plainly, that combination produces no circle, and that silence is the point.
Circles need both readings at once. Also, a green circle at the pane bottom means the statistic cleared -2.86 and z-score fell under -1.0 on a closed bar. Expect them to be rare. Indeed, the 15-bar cooldown and the alternating position state both thin them out further, and long stretches of trend produce none at all.
Every ADF Stationarity Pulse setting explained
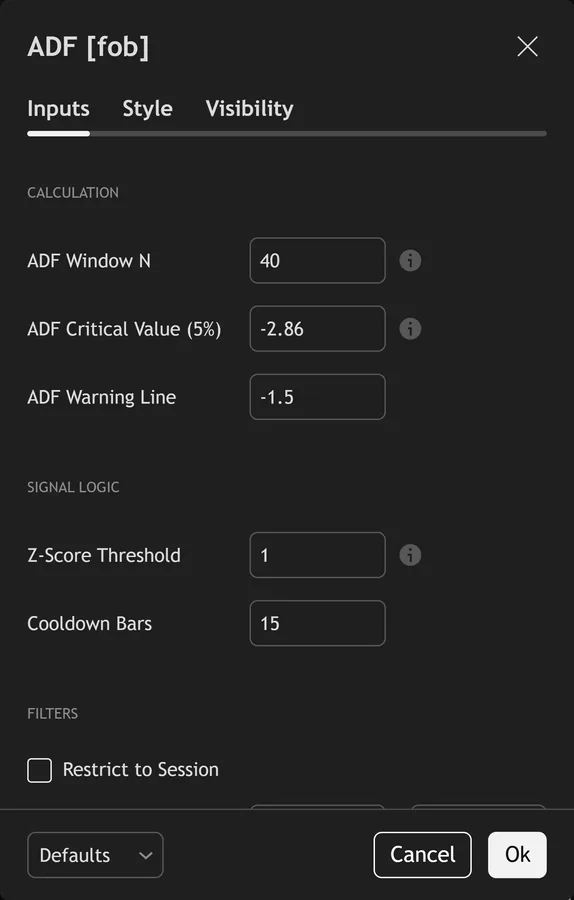
The script exposes 14 inputs, grouped in the settings panel exactly as shown below. Defaults are the published values.
Calculation
| Setting | What it does | Default | Range |
|---|---|---|---|
| ADF Window N | Number of closes used for the AR(1) regression. | 40 | 20 to 200 |
| ADF Critical Value (5%) | Approximate 5%% critical value for AR(1)-with-drift. | -2.86 | |
| ADF Warning Line | Sets the adf warning line used in the calculation. | -1.5 |
Signal Logic
| Setting | What it does | Default | Range |
|---|---|---|---|
| Z-Score Threshold | Price must be this many SDs away from its mean. | 1.0 | 0.3 to 3.0 |
| Cooldown Bars | Sets the cooldown bars used in the calculation. | 15 | 1 to 60 |
Filters
| Setting | What it does | Default | Range |
|---|---|---|---|
| Restrict to Session | Toggles restrict to session on the chart. | off | on / off |
| Session Window | Controls session window. | 0000-2400 |
Visual
| Setting | What it does | Default | Range |
|---|---|---|---|
| Show Z-Score Plot | Toggles show z-score plot on the chart. | on | on / off |
| Show Dashboard | Toggles show dashboard on the chart. | on | on / off |
| Show 3-Layer Glow | Toggles show 3-layer glow on the chart. | on | on / off |
| Buy Color | Colour used for buy color. | #39ff14 | |
| Sell Color | Colour used for sell color. | #ff2d78 | |
| ADF Color | Colour used for adf color. | #00d4ff | |
| Dashboard BG | Colour used for dashboard bg. | color.new(#0a1118, 16) |
Alerts built into ADF Stationarity Pulse
The script ships 12 alert conditions. Still, open the alert dialog on the chart, pick the indicator as the condition source, then choose the event you want. Alerts fire on the close of the bar, so they follow the same confirmed-bar rule the on-chart signals use.
- ADF Buy
- ADF Sell
- ADF Any Signal
- ADF Regime On
- ADF Regime Off
- ADF Warning Cross
- ADF Z Stretched Down
- ADF Z Stretched Up
- ADF Z Mean Reclaim
- ADF Webhook JSON
Other markets and timeframes
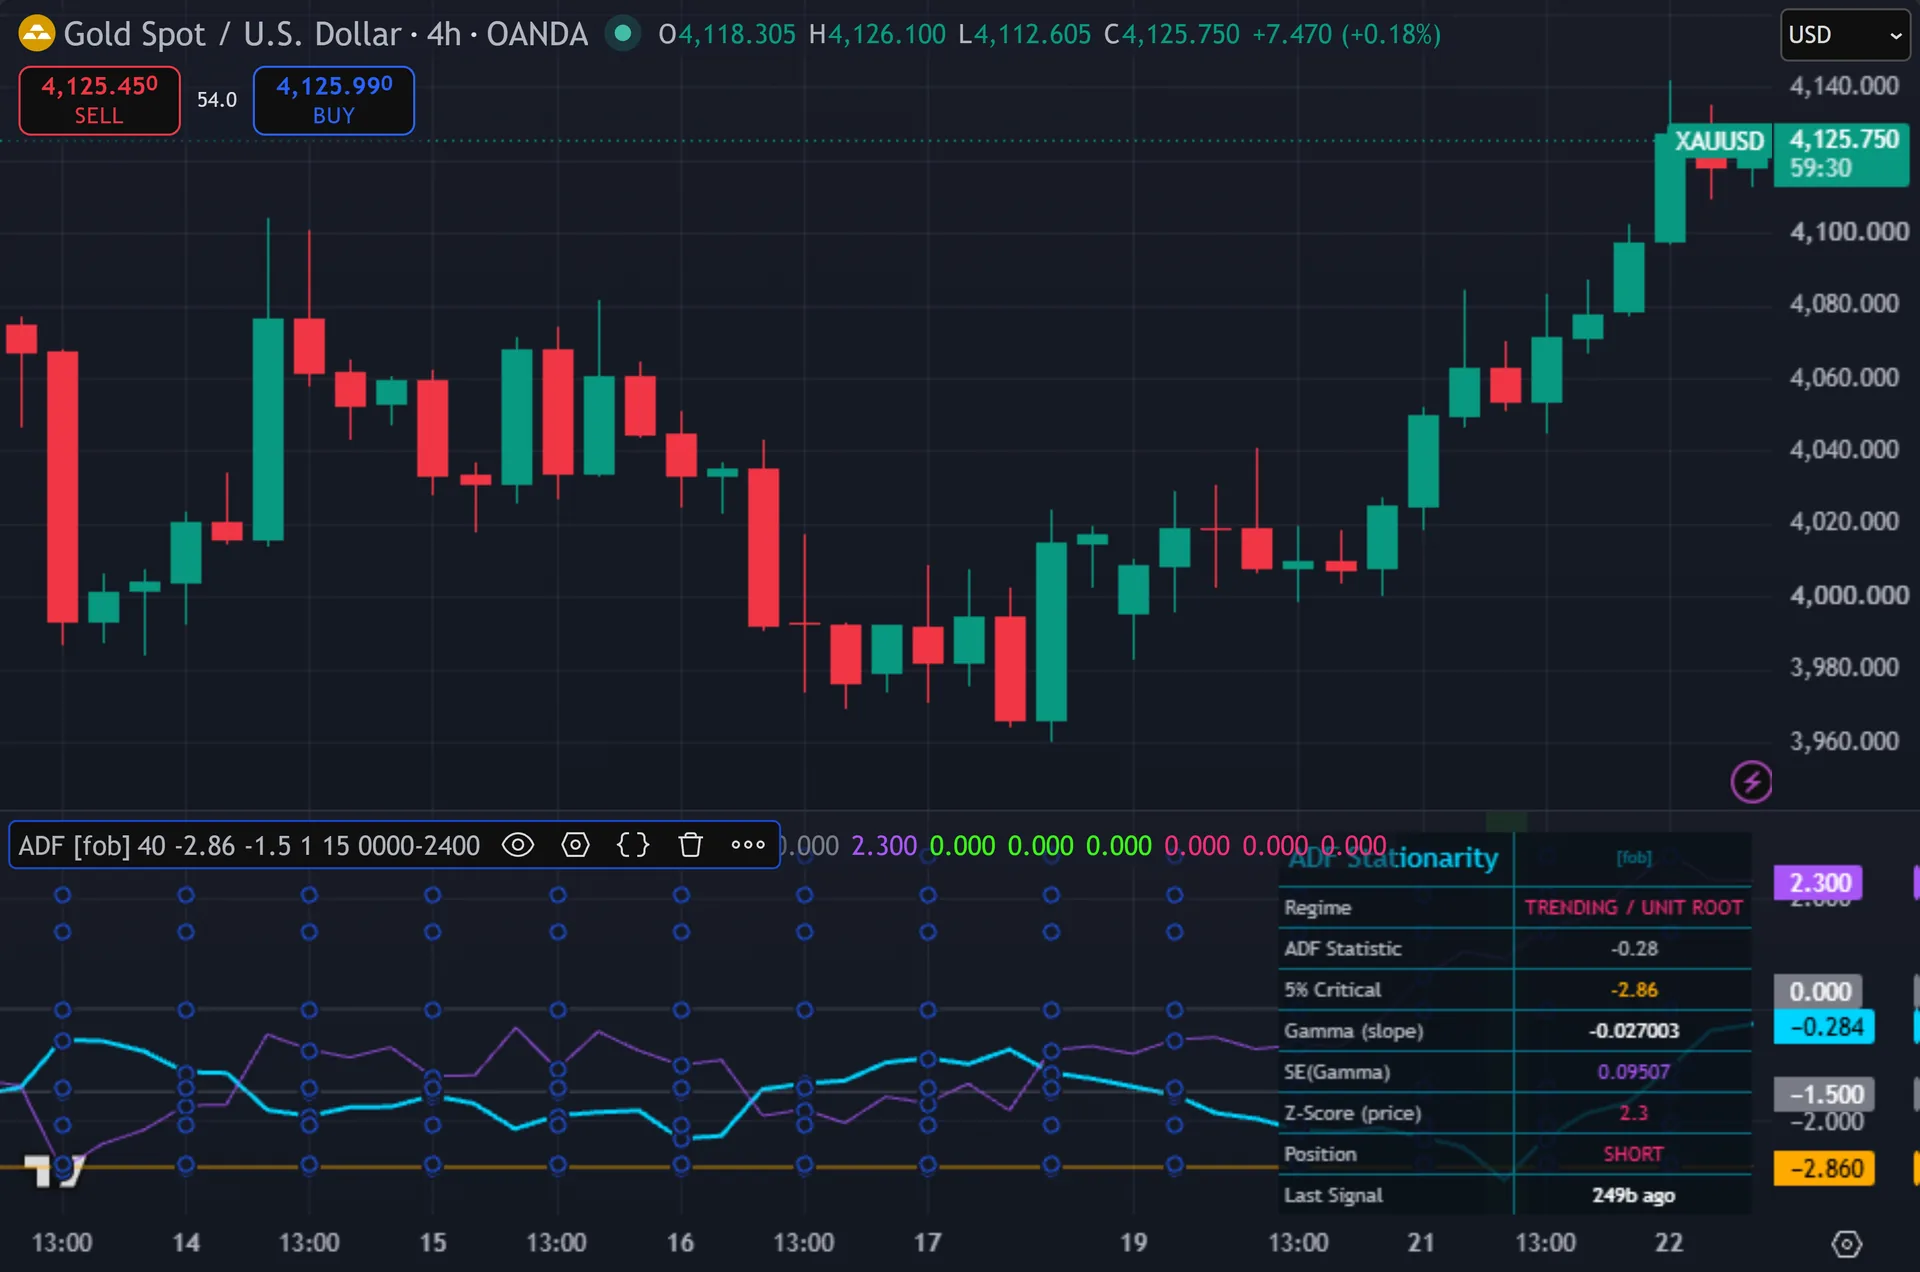
Both inputs to the decision are unit free. Thus, a t-statistic carries no price scale, and a z-score measures deviations rather than pips. So the defaults transfer straight to indices, gold, crypto and equities with no retuning. Hence, volume never enters the calculation, which avoids the usual spot forex problem. The window length is the setting to revisit, since 40 bars covers minutes on M1 and months on the daily, and the regime you measure depends entirely on that span.
Limitations worth knowing
The test runs on the raw close series of one symbol. Next, it is not a cointegration test and not a pairs-trading tool. It cannot tell you whether two instruments move together, and it says nothing about the spread between them.
Statistics on 40 observations stay noisy. Then, the script re-runs the same test on every bar, so some readings dip under -2.86 by chance rather than by structure. Repeated testing on overlapping windows inflates that. Yet, treat a single bar below the line as weaker evidence than a sustained run below it.
The tool describes a regime. Truly, it does not manage a trade. It offers no stop, no target, no sizing rule and no view on trend direction. Plainly, a regime can also flip between bars, which leaves an open idea without the condition that justified it. The pane line and the green tint recalculate on every tick, so both move while a bar is still forming, even though the circles wait for the close.
Get ADF Stationarity Pulse on TradingView
Open ADF Stationarity Pulse on TradingView
If you also trade MetaTrader, the MT4 and MT5 indicator library is available below.
Get the complete indicator library
One email unlocks the full MT4 and MT5 indicator library. Also, this TradingView script stays free on TradingView – the button above adds it to your chart.
Using it alongside MetaTrader
Adding a script on TradingView takes one click, so there is no install step here. Indeed, if you want the same idea on MetaTrader, the MT4 and MT5 indicator installation guide walks through copying files into the data folder and attaching them to a chart. You can also browse the full MetaTrader indicator library, the MT4 indicators section, or the other free TradingView scripts published on this profile. For related chart tools see the MT5 indicators section and the forex trading strategies guides.
External references
- Stochastic oscillator on Wikipedia
- Stochastic Oscillator at Investopedia
- Raff Regression Channel at StockCharts ChartSchool
Frequently asked questions
Does it run a real ADF test or a simplified proxy?
It runs a real regression. Still, the script fits the change in price on the previous price and one lagged change. It solves the normal equations in closed form. Then it divides gamma by its own standard error to get the t-statistic. Two limits apply: it uses exactly one lag with no lag-length search, and it compares against a fixed -2.86 rather than a sample-size adjusted critical value.
Does ADF Stationarity Pulse repaint?
The buy and sell conditions require barstate.isconfirmed, so a printed circle belongs to a closed bar and stays there. Thus, the ADF line, the z-score line and the green background all recompute from the live close, so they move during a forming bar.
What does -2.86 mean?
It is the approximate 5% critical value for the Dickey-Fuller distribution with a constant. Hence, a statistic below it rejects the unit root hypothesis at that level, which the script reads as a mean-reverting window. You can edit the value in the settings if you want a stricter or looser test.
Can I use it for pairs trading?
Not directly. Next, it tests one price series, not the spread between two. A pairs approach needs the spread or the residual of a hedge ratio as its input, and this script never builds one. Then, use it instead as a regime filter on the single chart you have open.
How much should I rely on this indicator?
Treat it as one input, not a decision. Yet, it is a chart analysis tool, not trading advice. Test it on your own markets and timeframes before relying on it. Results are not guaranteed; past performance is not indicative of future results.

About the author
Written by Dominic Walsh, a Forex trader and MT4/MT5 indicator, Expert Advisor and script developer. Every tool on forexmt4systems.com is tested on live charts before release and ships with ready-to-use compiled MT4 (.ex4) and MT5 (.ex5) files. Learn more about the trader and developer behind this site.