Skip to content
  • About Us
  • Contact Us
  • Privacy Policy
  • Disclaimer
  • Install Guide
  • Editorial Policy
ForexMT4Systems
  • Indicators
    • MT4 Indicators
    • MT5 Indicators
    • AI
    • Bands and Channels
    • Binary Options
    • Breakout
    • Candle Sticks
    • Currency Strength
    • Cycles
    • Elliott Wave
    • Fibonacci
    • Gann
    • Harmonic
    • Heatmap
    • ICT
    • Ichimoku
    • Intraday
    • Levels
    • Liquidity
    • MACD
    • Momentum
    • Moving Average
    • Multi-Timeframe
    • News
    • Non-Repaint
    • Order Book
    • Order Flow
    • Oscillators
    • Overbought and Oversold
    • Pattern Recognition
    • Pivot Points and Fractals
    • Price Action
    • RSI
    • Range
    • Reversal
    • Risk Management
    • Scalper
    • Sessions
    • Signal and Forecast
    • Smart Money
    • Supply and Demand
    • Support and Resistance
    • Swing Trading
    • Trend
    • VWAP
    • Volatility
    • Volume
    • Volume Profile
    • ZigZag
  • Expert Advisors
  • Scripts
  • TradingView
    • All Free TradingView Indicators
    • Premium TradingView Indicators
  • Strategies
    • Forex
    • Breakout
    • Day Trading
    • ICT and SMC
    • Mean Reversion
    • News
    • Position
    • Price Action
    • Scalping
    • Swing
  • Guides
    • Best Indicators
    • Comparisons
    • How-To Guides
    • Indicator Settings
    • Currency Pairs
    • Timeframes
  • Education
    • Smart Money Concepts
    • Technical Analysis
    • Forex Basics
    • Risk Management
    • Prop Firm Trading
    • Trading Psychology
    • Candlestick Patterns
    • Chart Patterns
    • Fundamental Analysis
    • Trading Styles
    • Trading Plan and Journal
    • Order Types and Execution
    • Automated and Copy Trading
    • Market Sentiment
    • Forex Brokers
    • Backtesting and Systems
  • Tools
    • Position Size Calculator
    • Pip Value Calculator
    • Profit Calculator
    • Risk Reward Calculator
    • Trading Journal
    • Economic Calendar
    • Market Hours Clock
    • Forex Heatmap
    • View All 41 tools ->

Chart Patterns

Chart pattern education: head and shoulders, double tops, triangles, harmonic patterns, and Elliott Wave theory explained with examples.

Wolfe Wave Pattern: Rules, Target Line and Honest Limits

wolfe wave pattern - Wolfe Wave Pattern: Rules, Target Line and Honest Limits featured image

The wolfe wave pattern counts five turning points on a chart, then uses two of them to draw a target line. Its appeal is the tidy geometry, and its weakness …

Leave a comment

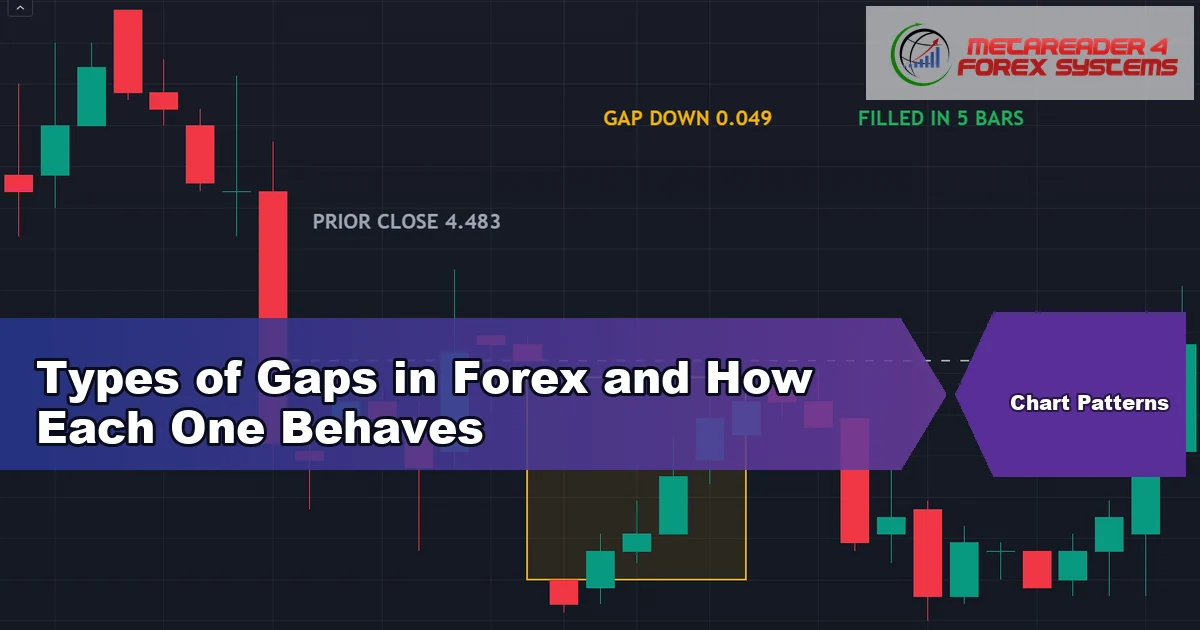
Types of Gaps in Forex and How Each One Behaves

types of gaps in forex - Types of Gaps in Forex and How Each One Behaves featured image

Most guides to the types of gaps in forex borrow their list from the stock market and forget to mention the awkward part. Spot currency trades almost around the clock, …

Leave a comment

Measured Move Targets: How to Set and Manage Them

measured move targets - Measured Move Targets: How to Set and Manage Them featured image

Measured move targets take the height of a chart pattern and project that same distance beyond the level which confirmed it. The arithmetic takes seconds, and the honest part is …

Leave a comment

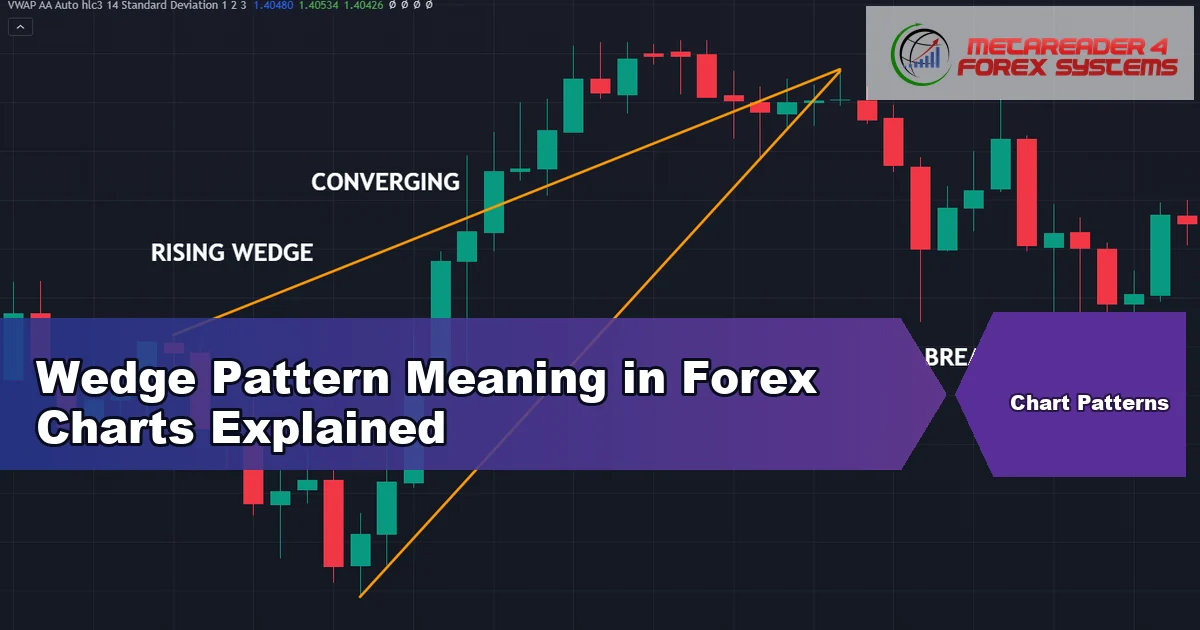
Wedge Pattern Meaning in Forex Charts Explained

wedge pattern meaning - Wedge Pattern Meaning in Forex Charts Explained featured image

The wedge pattern meaning rests on one detail: both boundary lines slope the same way while the range between them narrows. That single feature separates a wedge from every triangle …

Leave a comment

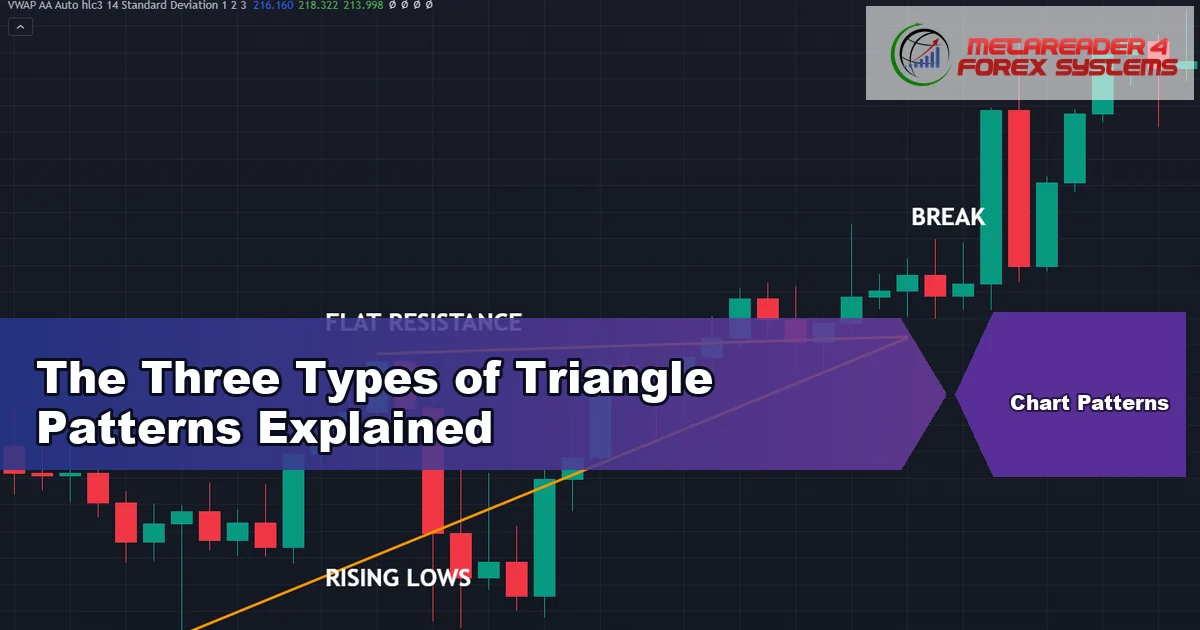
The Three Types of Triangle Patterns Explained

types of triangle patterns - The Three Types of Triangle Patterns Explained featured image

The three types of triangle patterns all describe one thing: a range that keeps narrowing. What separates them is the slope of the two boundary lines, and that slope tells …

Leave a comment

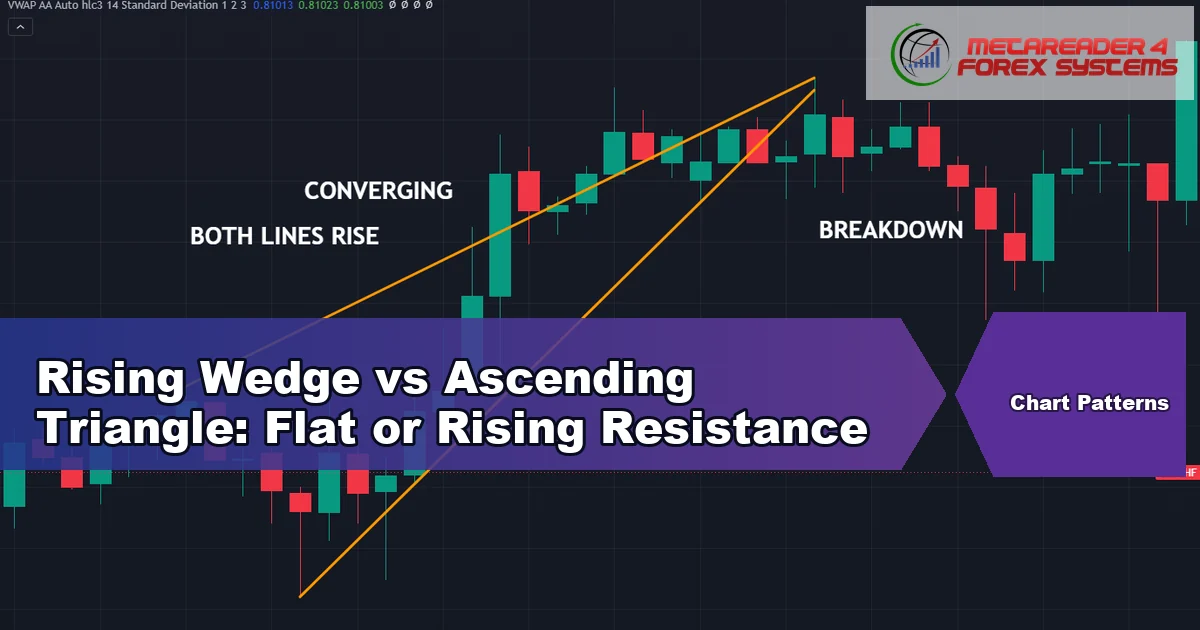
Rising Wedge vs Ascending Triangle: Flat or Rising Resistance

rising wedge vs ascending triangle - Rising Wedge vs Ascending Triangle: Flat or Rising Resistance featured image

Two shapes with rising lows sit at opposite ends of the textbook. The rising wedge vs ascending triangle problem comes down to a single line on the chart, and most …

Leave a comment

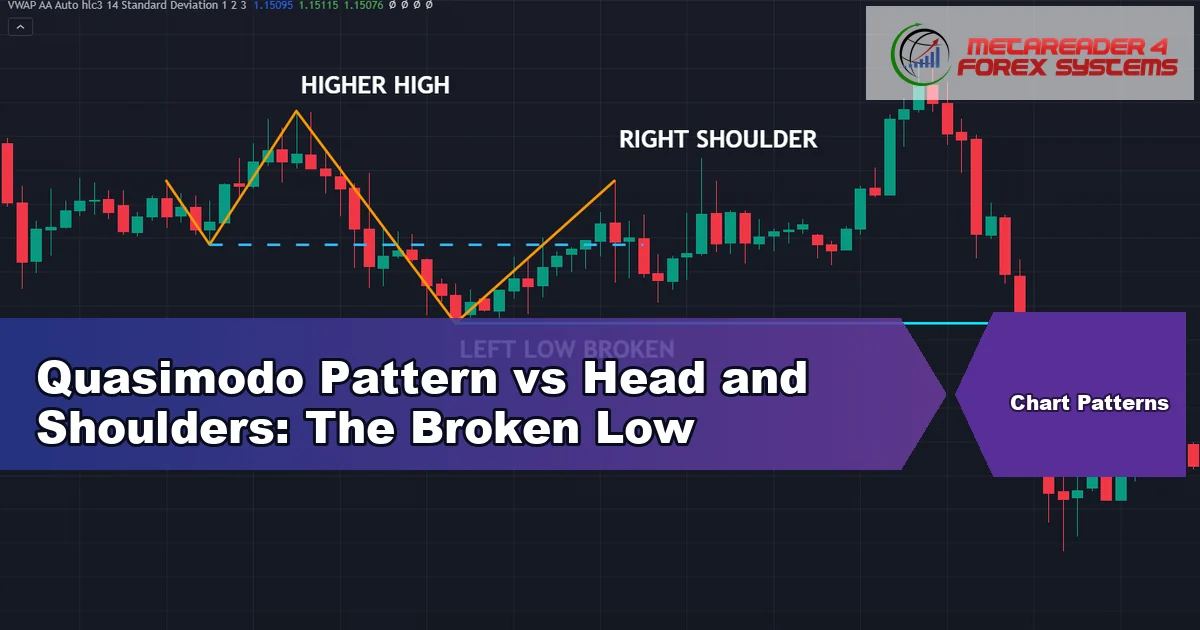
Quasimodo Pattern vs Head and Shoulders: The Broken Low

quasimodo pattern vs head and shoulders - Quasimodo Pattern vs Head and Shoulders: The Broken Low featured image

One structure has a classical name and a century of textbooks behind it. The other arrived through price-action forums with a strange nickname, and the quasimodo pattern vs head and …

Leave a comment

A Practical List of Harmonic Patterns for Forex Charts

list of harmonic patterns - A Practical List of Harmonic Patterns for Forex Charts featured image

A list of harmonic patterns is really a list of Fibonacci ratios. Every shape uses the same five points, X, A, B, C and D, and the ratios between the …

Leave a comment

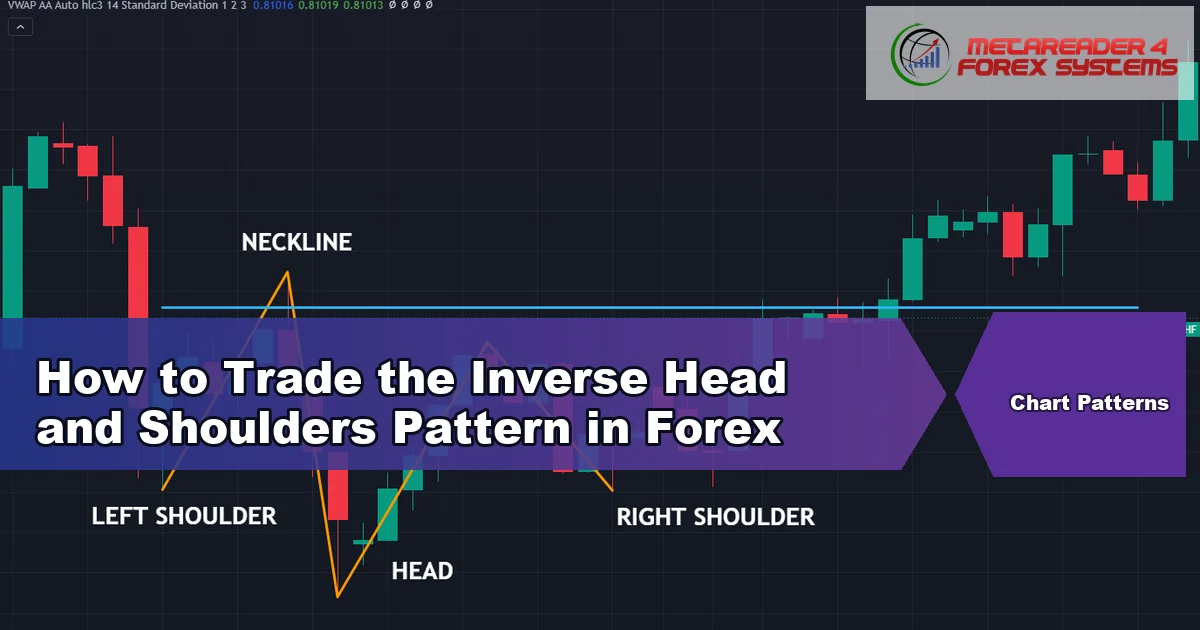
How to Trade the Inverse Head and Shoulders Pattern in Forex

inverse head and shoulders pattern - How to Trade the Inverse Head and Shoulders Pattern in Forex featured image

An inverse head and shoulders pattern gives you three concrete decisions: where to enter, where the stop belongs, and how far to project the move. This guide leads with those …

Leave a comment

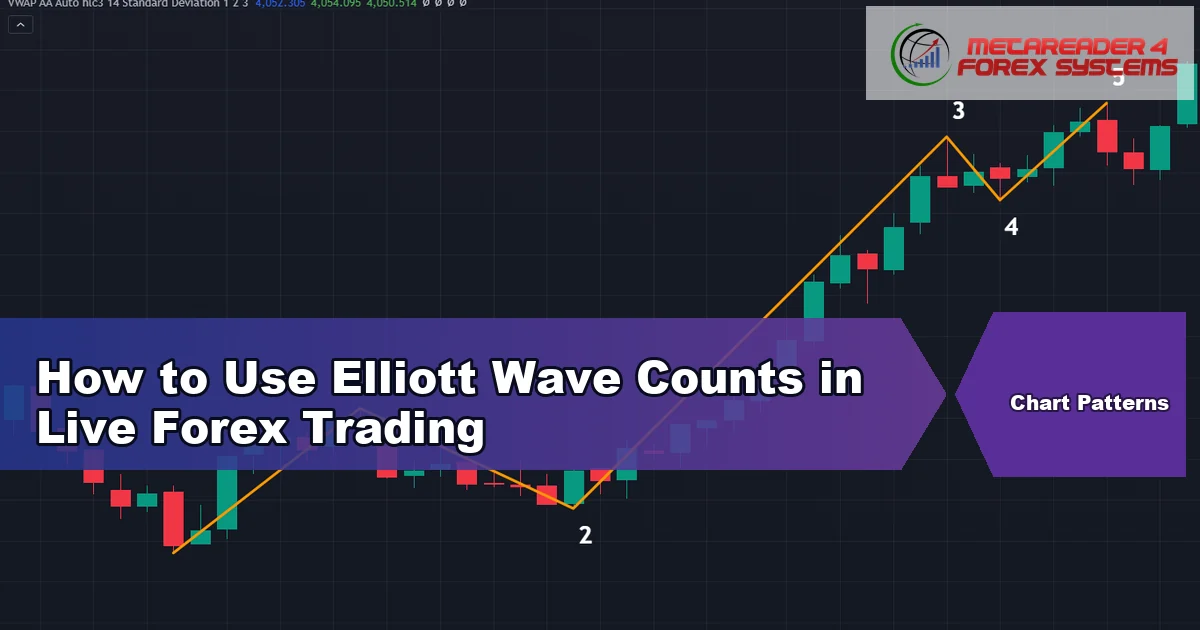
How to Use Elliott Wave Counts in Live Forex Trading

how to use elliott wave - How to Use Elliott Wave Counts in Live Forex Trading featured image

Plenty of traders learn the five-three shape and then stall. Knowing how to use elliott wave counts on a live chart takes a different set of habits from reciting the …

Leave a comment

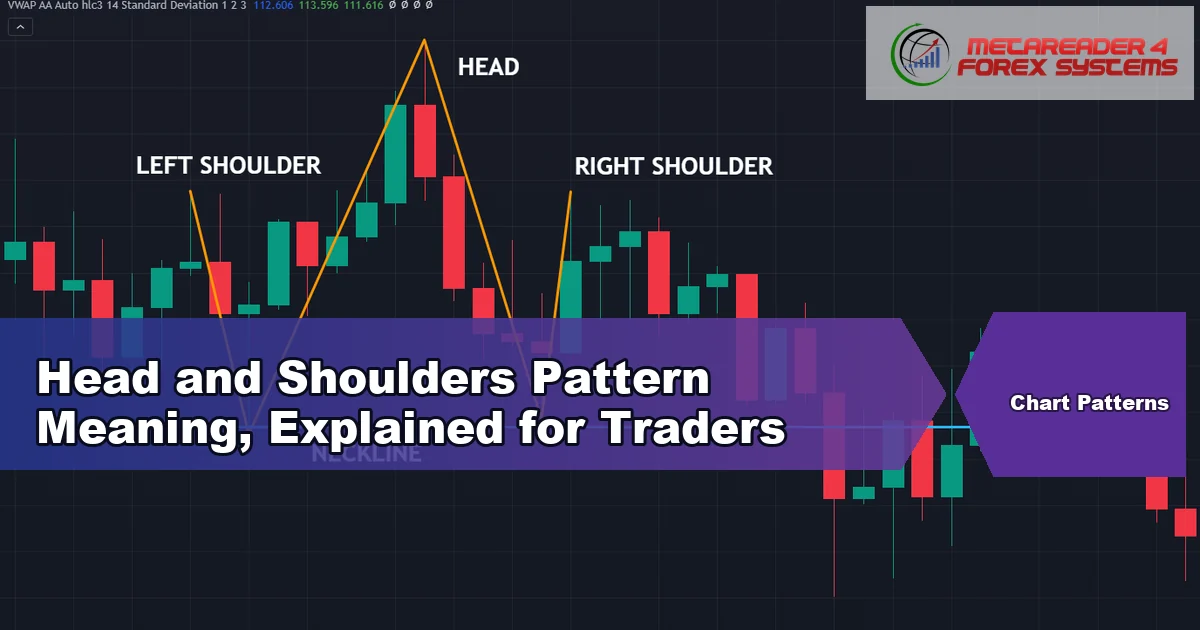
Head and Shoulders Pattern Meaning, Explained for Traders

head and shoulders pattern meaning - Head and Shoulders Pattern Meaning, Explained for Traders featured image

The head and shoulders pattern meaning comes down to three pushes at a high, with the middle push standing tallest. Buyers try three times, and the line drawn under the …

Leave a comment

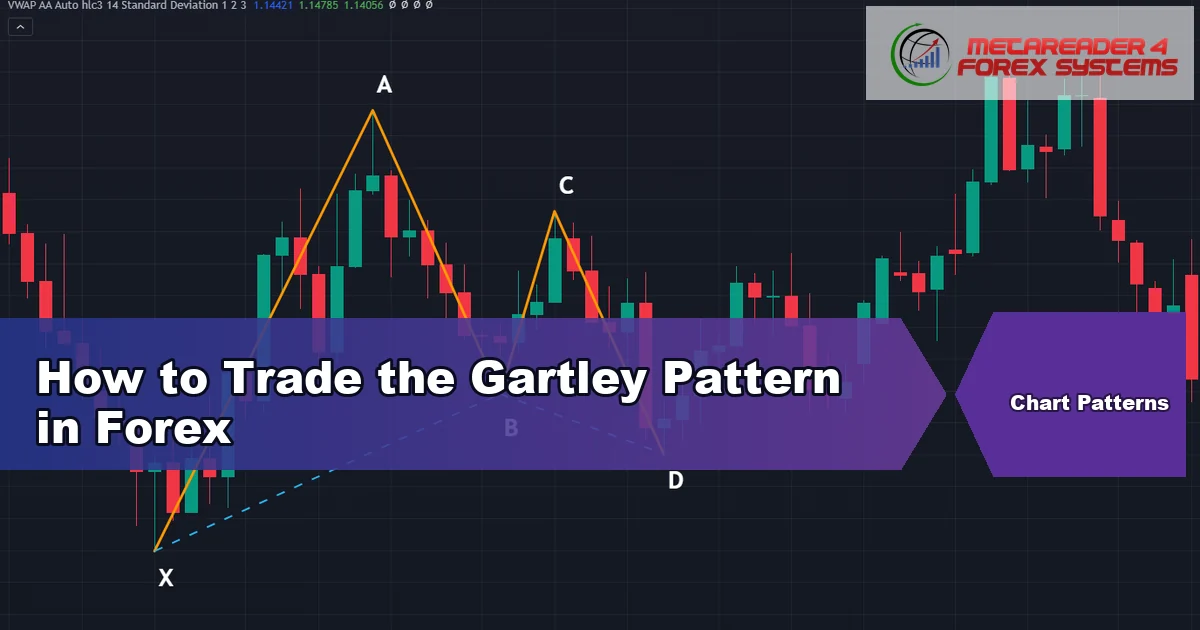
How to Trade the Gartley Pattern in Forex

gartley pattern - How to Trade the Gartley Pattern in Forex featured image

The gartley pattern is a five-point price structure held together by two Fibonacci numbers. Point B retraces about 0.618 of the first leg, and point D completes near 0.786 of …

Leave a comment

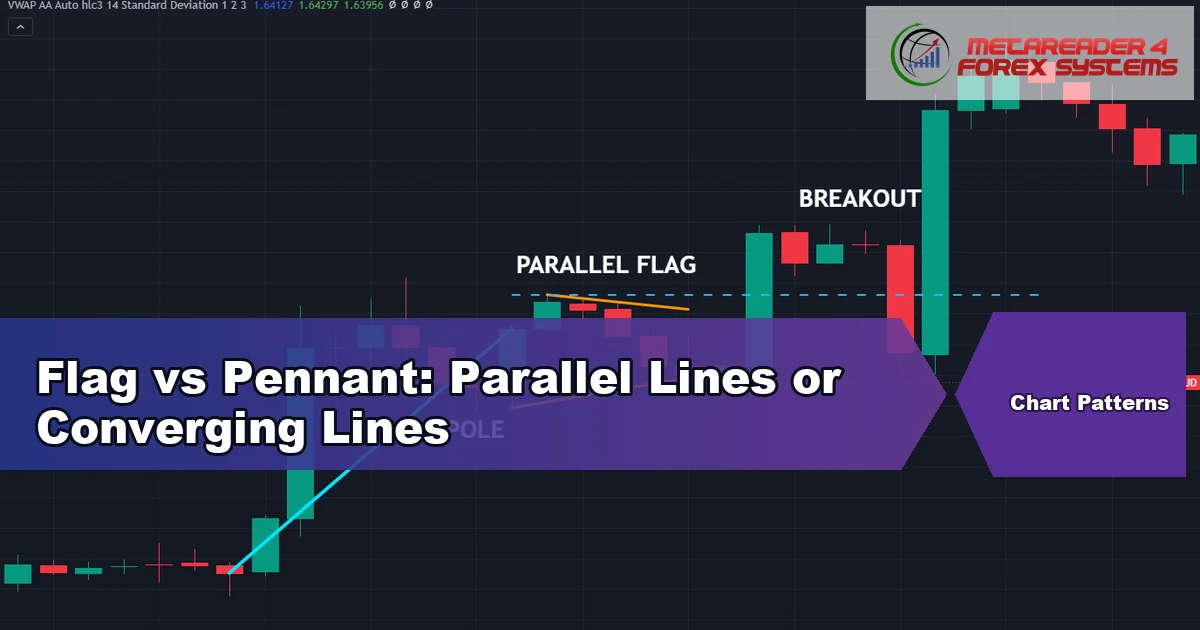
Flag vs Pennant: Parallel Lines or Converging Lines

flag vs pennant - Flag vs Pennant: Parallel Lines or Converging Lines featured image

Two continuation shapes get mixed up more than any other pair on a forex chart. The flag vs pennant question has one honest answer, and it lives in the boundary …

Leave a comment

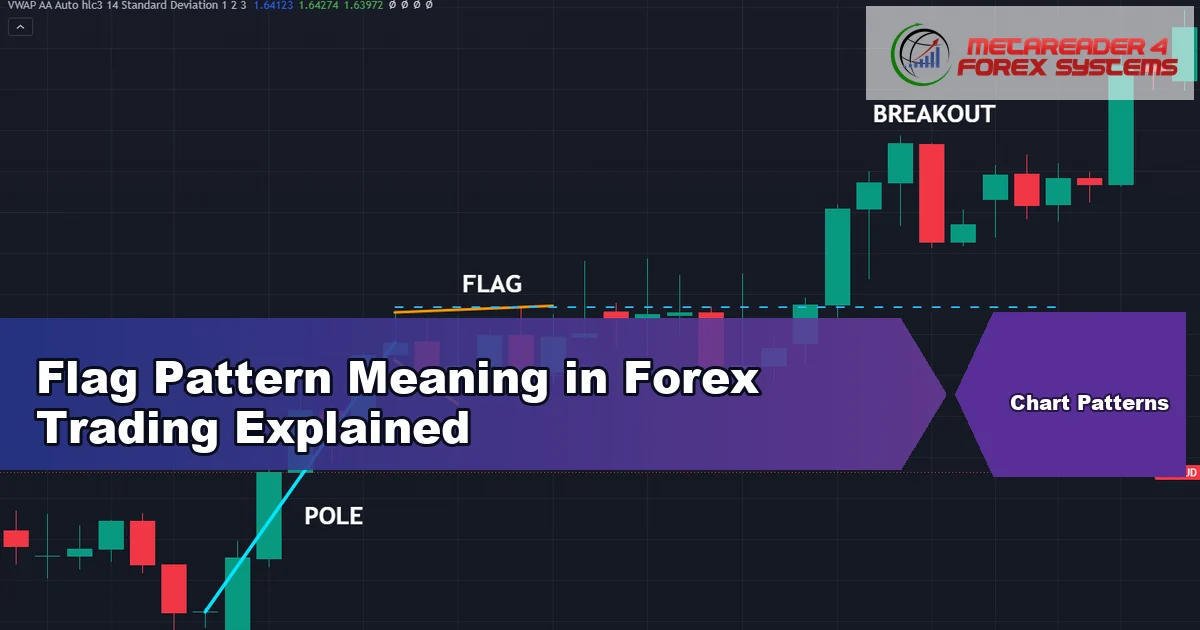
Flag Pattern Meaning in Forex Trading Explained

flag pattern meaning - Flag Pattern Meaning in Forex Trading Explained featured image

The flag pattern meaning starts with a pole. A sharp, near-vertical move runs first, and only then does a small, shallow consolidation drift back against it. Without that pole you …

Leave a comment

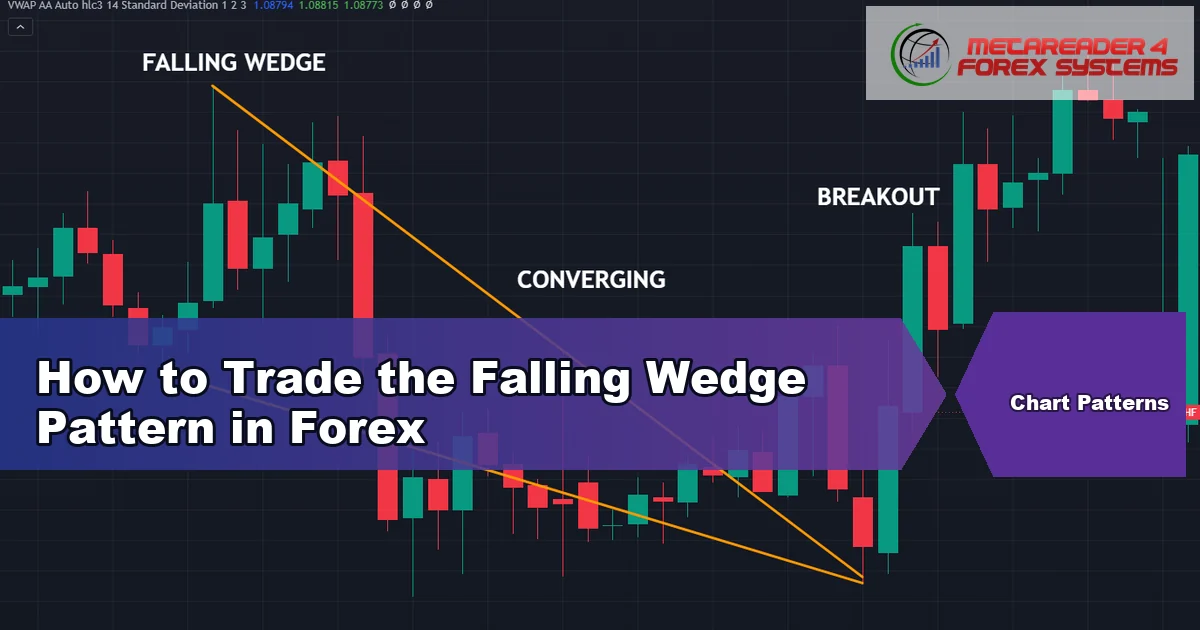
How to Trade the Falling Wedge Pattern in Forex

falling wedge pattern - How to Trade the Falling Wedge Pattern in Forex featured image

A falling wedge pattern gives you three things a chart rarely offers together: a defined entry level, a defined stop and a defined invalidation. Both boundaries slope down, and the …

Leave a comment

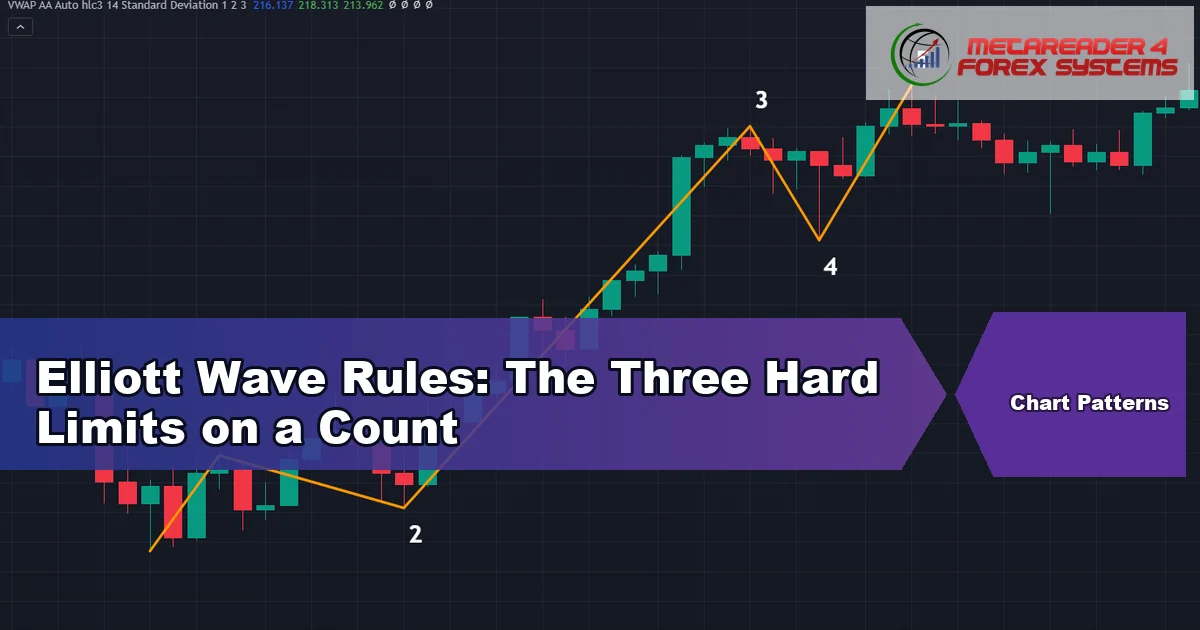
Elliott Wave Rules: The Three Hard Limits on a Count

elliott wave rules - Elliott Wave Rules: The Three Hard Limits on a Count featured image

Elliott wave rules come down to three conditions. Break one of them and the sequence you drew stops qualifying as an impulse, whatever the chart looks like. Everything else in …

Leave a comment

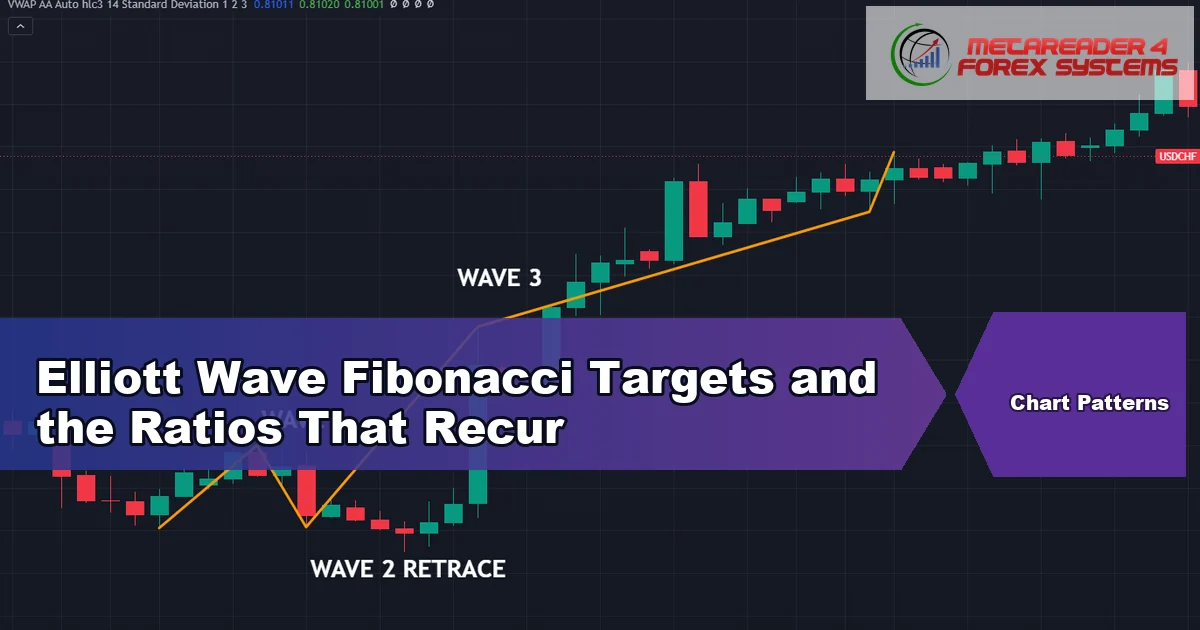
Elliott Wave Fibonacci Targets and the Ratios That Recur

elliott wave fibonacci targets - Elliott Wave Fibonacci Targets and the Ratios That Recur featured image

Wave analysts lean on a small set of ratios. Elliott wave fibonacci targets describe where a leg has often finished in the past, and nothing stronger than that. This guide …

Leave a comment

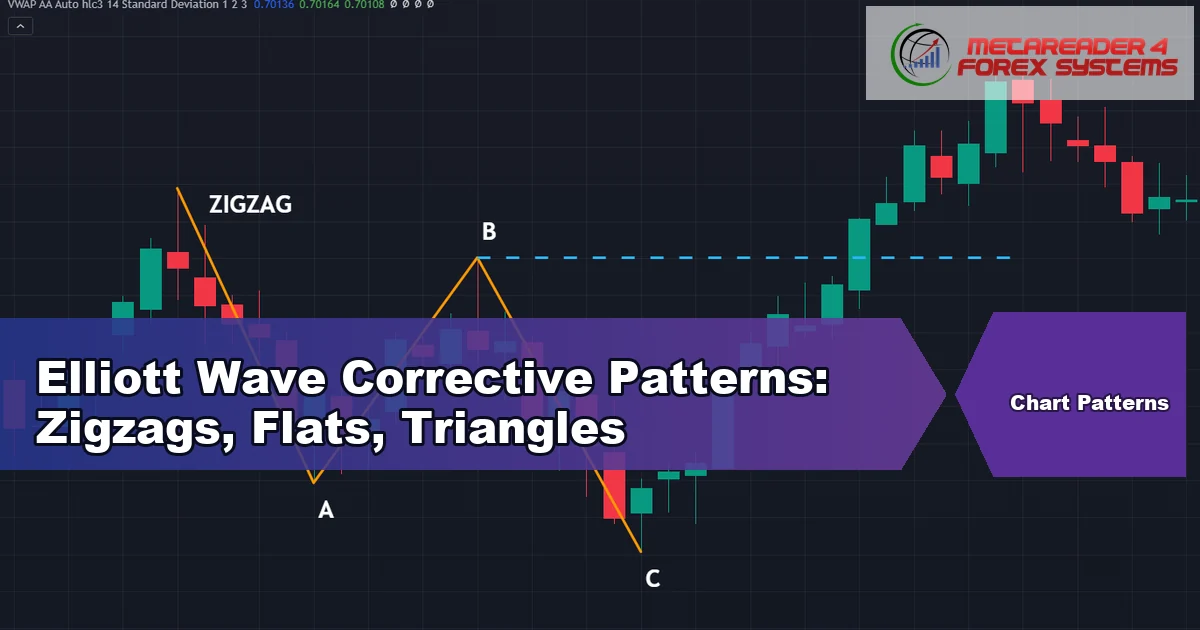
Elliott Wave Corrective Patterns: Zigzags, Flats, Triangles

elliott wave corrective patterns - Elliott Wave Corrective Patterns: Zigzags, Flats, Triangles featured image

Impulses look tidy on a chart. Elliott wave corrective patterns rarely do, and that gap causes most of the frustration traders feel with wave analysis. This guide covers the three …

Leave a comment

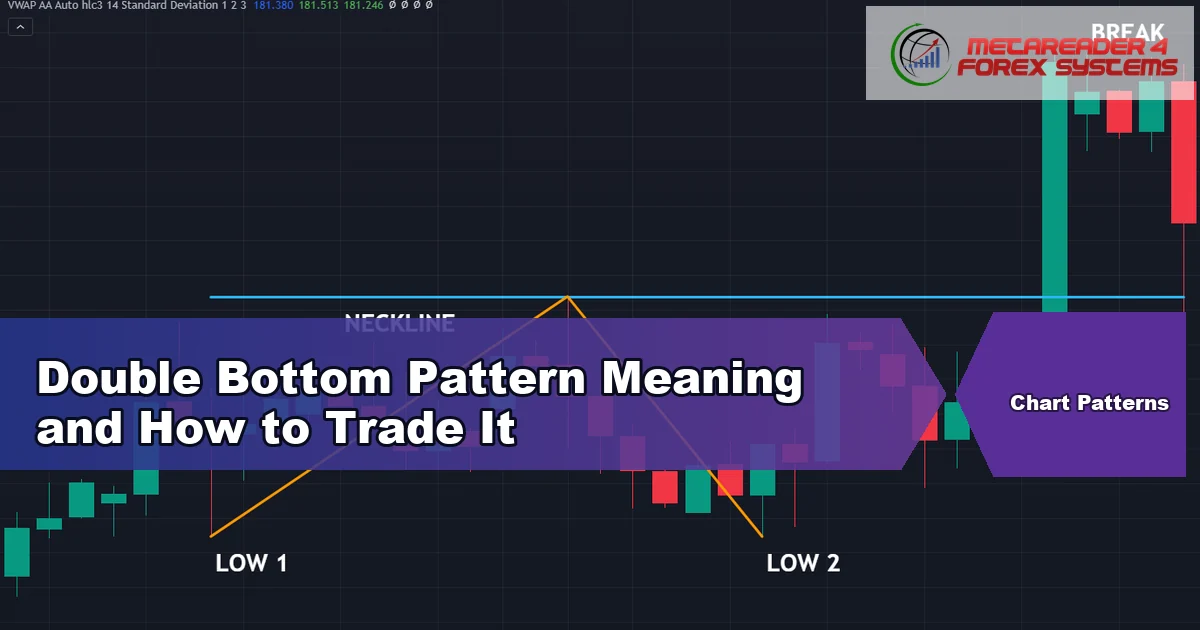
Double Bottom Pattern Meaning and How to Trade It

double bottom pattern meaning - Double Bottom Pattern Meaning and How to Trade It featured image

The double bottom pattern meaning starts with a level that stopped a decline twice. Two lows form at a similar price, a peak sits between them, and only a close …

Leave a comment

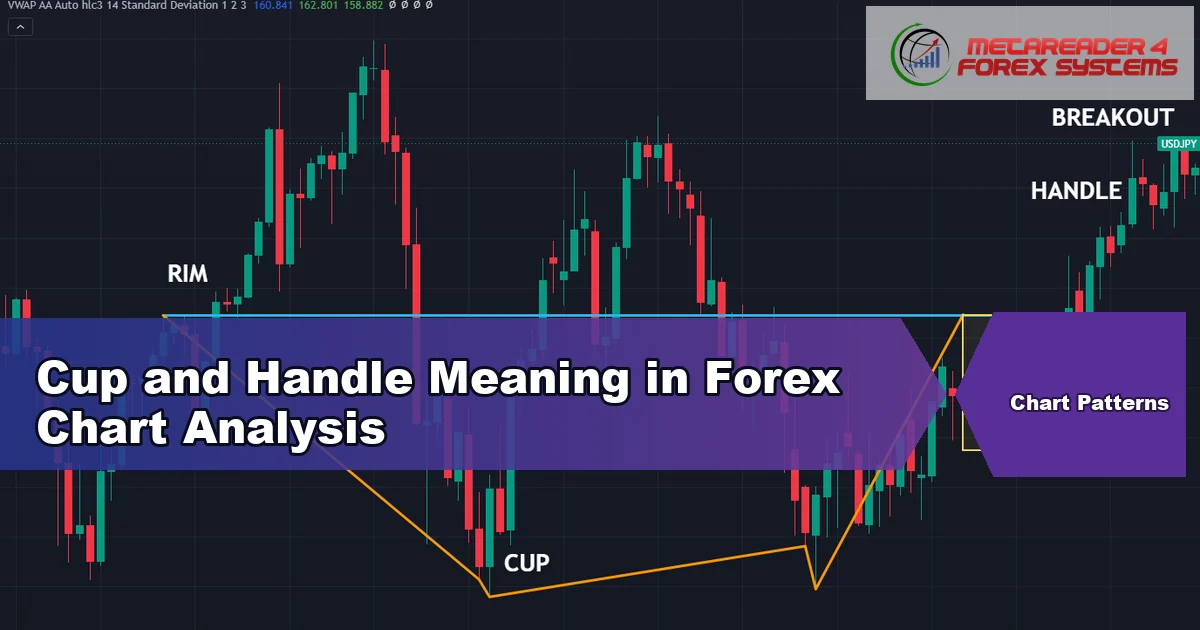
Cup and Handle Meaning in Forex Chart Analysis

cup and handle meaning - Cup and Handle Meaning in Forex Chart Analysis featured image

The cup and handle meaning rests on one word: roundness. A base that curves gradually between two similar highs, followed by a shallow pullback, is what separates this shape from …

Leave a comment

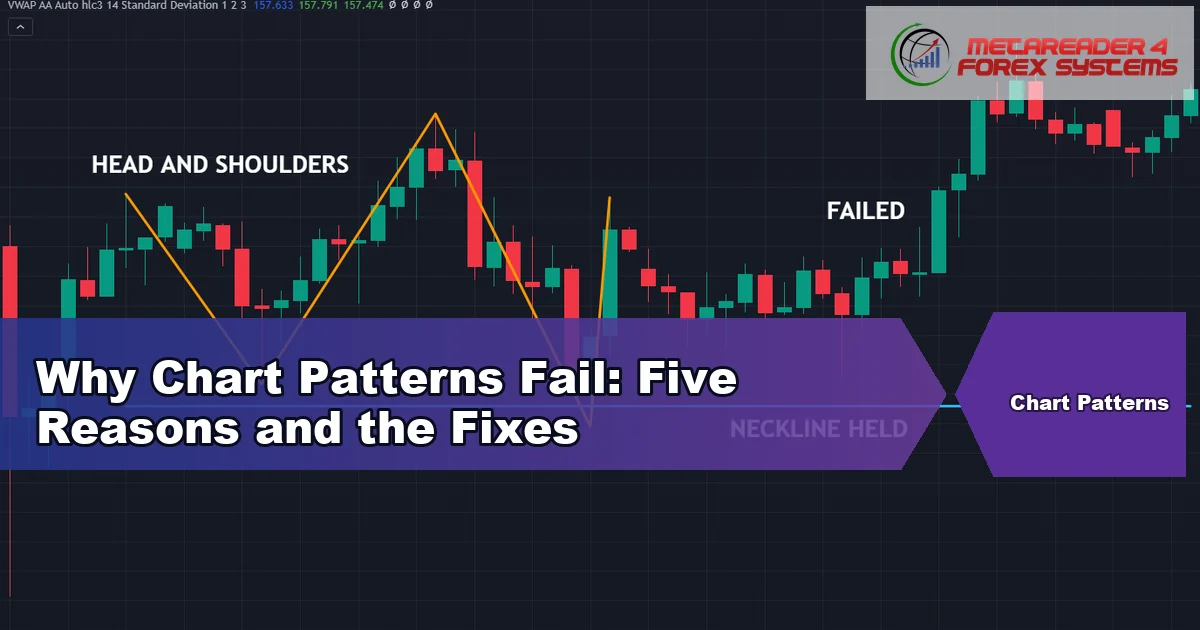
Why Chart Patterns Fail: Five Reasons and the Fixes

why chart patterns fail - Why Chart Patterns Fail: Five Reasons and the Fixes featured image

Every pattern guide shows you the textbook example that worked. Almost none of them explain why chart patterns fail so often, which leaves traders blaming themselves for something structural. This …

Leave a comment

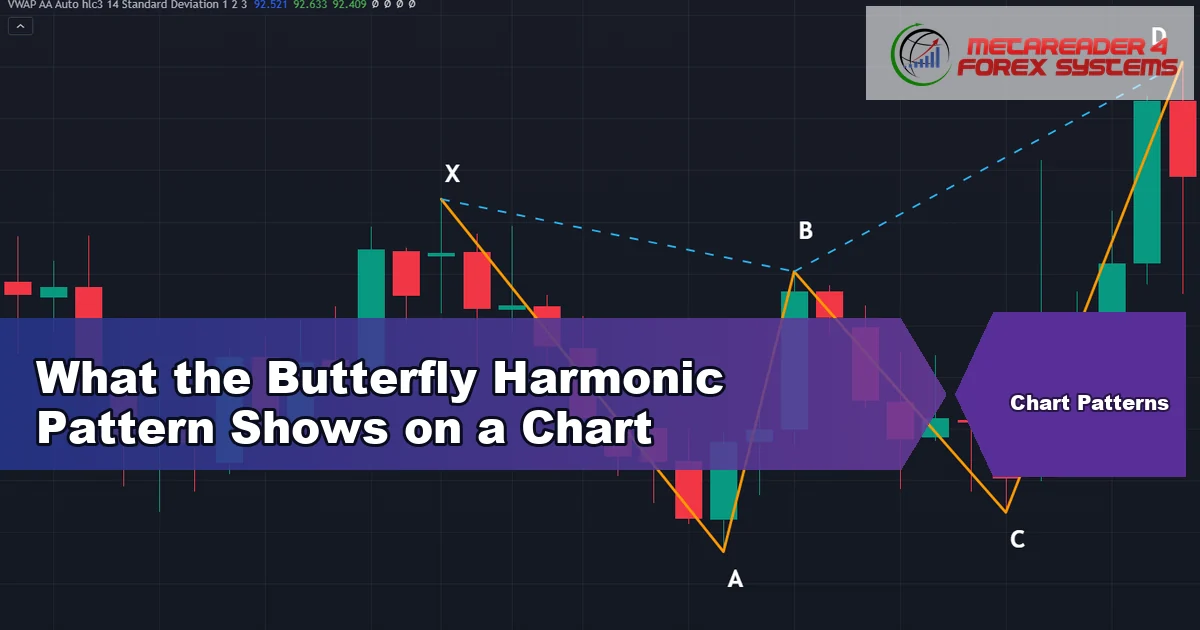
What the Butterfly Harmonic Pattern Shows on a Chart

butterfly harmonic pattern - What the Butterfly Harmonic Pattern Shows on a Chart featured image

The butterfly harmonic pattern is the member of the family that refuses to stay inside its own first leg. Point B retraces about 0.786 of XA, and point D finishes …

Leave a comment

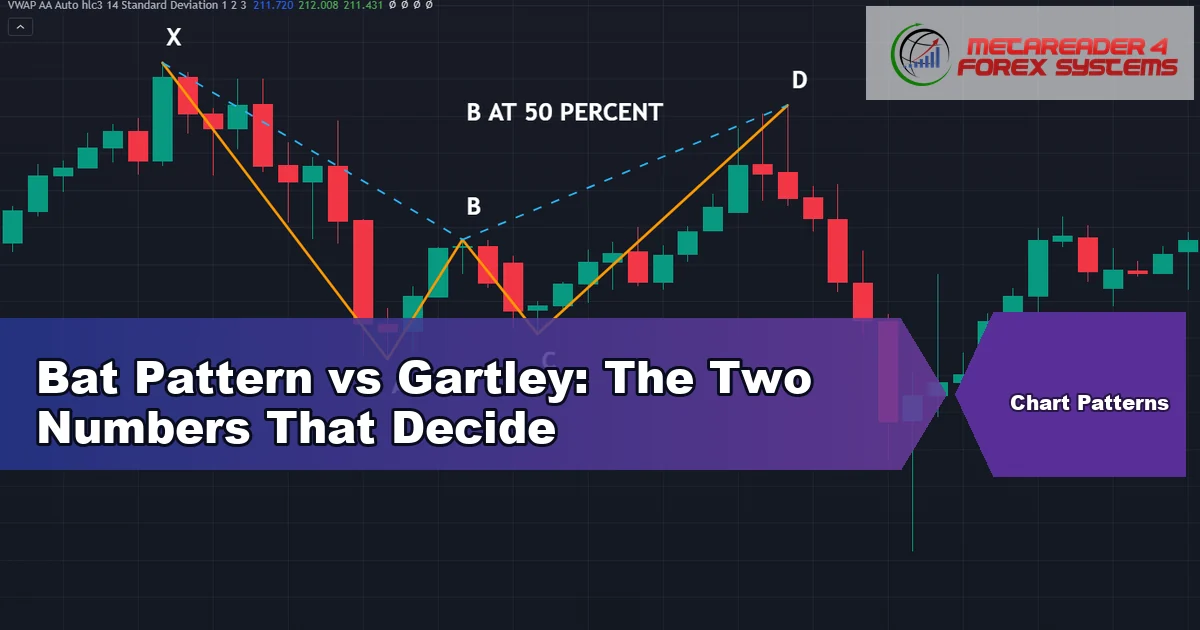
Bat Pattern vs Gartley: The Two Numbers That Decide

bat pattern vs gartley - Bat Pattern vs Gartley: The Two Numbers That Decide featured image

Bat pattern vs gartley comes down to two measurements and nothing else. The B point retraces about 0.382 to 0.5 of XA in a bat, against roughly 0.618 in a …

Leave a comment

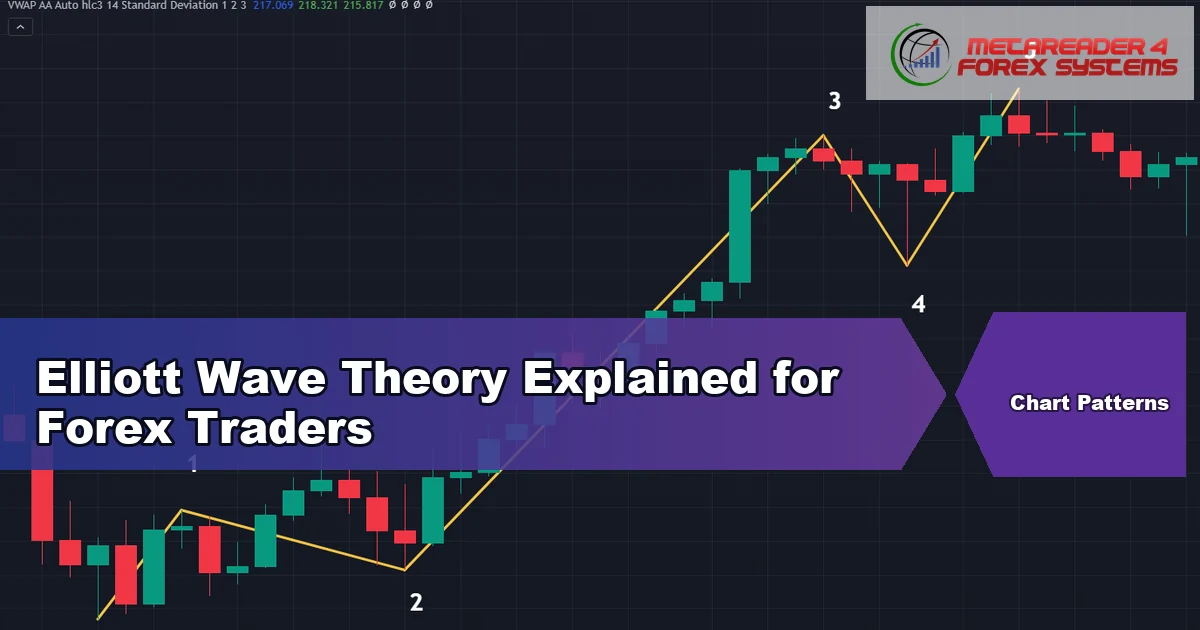
Elliott Wave Theory Explained for Forex Traders

elliott wave theory - Elliott Wave Theory Explained for Forex Traders featured image

Elliott wave theory says market moves unfold in repeating shapes: five waves with the larger trend, then three against it. Ralph Nelson Elliott built that model in the 1930s from …

Leave a comment

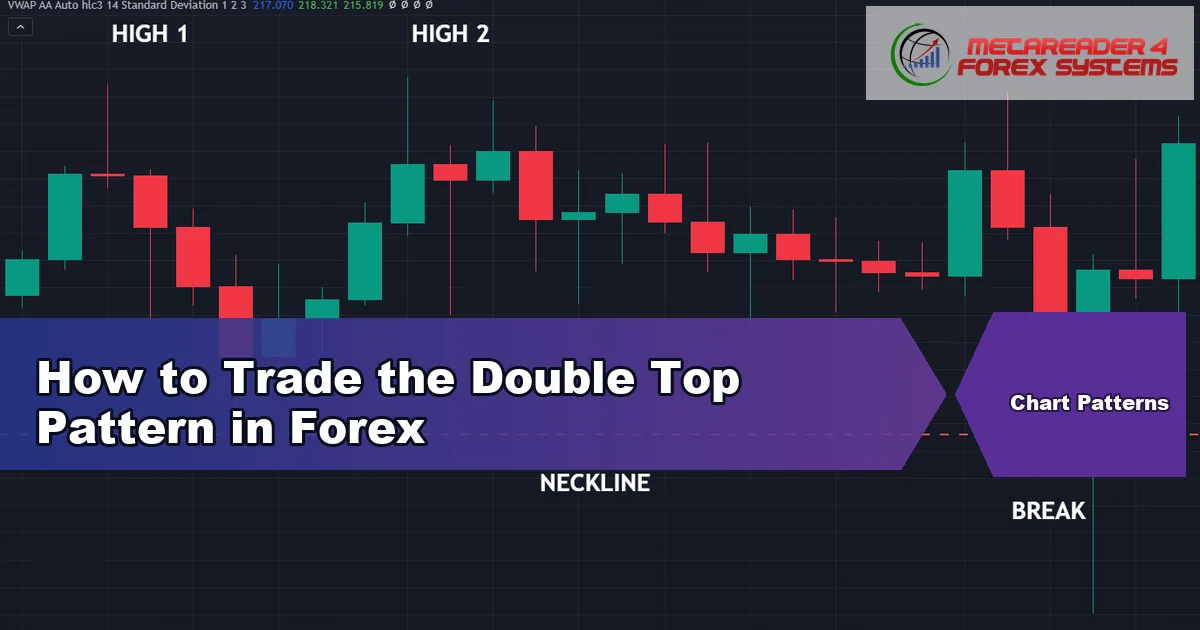
How to Trade the Double Top Pattern in Forex

double top pattern - How to Trade the Double Top Pattern in Forex featured image

The double top pattern marks a level that turned price away twice. Two highs form at roughly the same price, a trough sits between them, and only a close below …

Leave a comment
TradingView charts and trading platform
Instant Funding Master funded trading account offer
Cashback Forex broker rebates

Risk Disclosure: Trading futures and foreign exchange carries a high degree of risk and is not appropriate for everyone. You may lose part, all, or more than the funds you commit. Trade only with risk capital — money you can afford to part with without harming your financial stability or way of life. If you do not hold surplus capital of this kind, you should not trade these markets. Past performance is not necessarily indicative of future results.

Hypothetical Performance Disclosure: Simulated or hypothetical results carry built-in limitations, several of which are noted here. No claim is made that any account has achieved or is likely to achieve gains or losses comparable to those shown; in practice, live outcomes often diverge sharply from modelled ones. A key shortcoming of hypothetical figures is that they are usually constructed after the fact, with full knowledge of how the market moved. Back-tested trading also puts no real money on the line, so no simulated record can fully reflect how financial risk shapes live decisions. A trader's capacity to absorb drawdowns, or to keep following a system through a losing streak, materially affects real returns and cannot be reproduced in a model. Many further market and execution variables likewise escape any hypothetical calculation, and each can work against actual trading performance.

Testimonials Disclosure: Comments or reviews shown on this site reflect individual experiences and may not match the results of other visitors or customers. They are not a promise of future performance or success.

General Disclosure & Limitation of Liability: FOREXMT4SYSTEMS.COM publishes all material for educational and informational purposes only and accepts no liability for trading losses or for any decisions taken on the basis of this content. We may receive compensation through advertising, affiliate partnerships, or product sales; this never compromises our editorial independence or transparency. Trading carries risk, and past performance does not assure future results.

All Indicators A-Z · Install Guide · Editorial Policy

Copyright © 2026 FOREXMT4SYSTEMS.COM