
Measured move targets take the height of a chart pattern and project that same distance beyond the level which confirmed it. The arithmetic takes seconds, and the honest part is what the resulting number actually means.
A projection marks a reference point rather than a destination. Price reaches it sometimes, stalls well short at other times, and that gap between the two outcomes explains why partial exits exist at all.
What Measured Move Targets Are
Every classical chart shape has a height. Measure from its extreme to the level that completes it, and you hold a distance in price.
Project that distance from the confirmation level and a target appears. Nothing more complicated happens along the way.
The logic behind it stays crude but sensible. A shape that needed a certain range to build tends to release on a similar scale once it breaks.
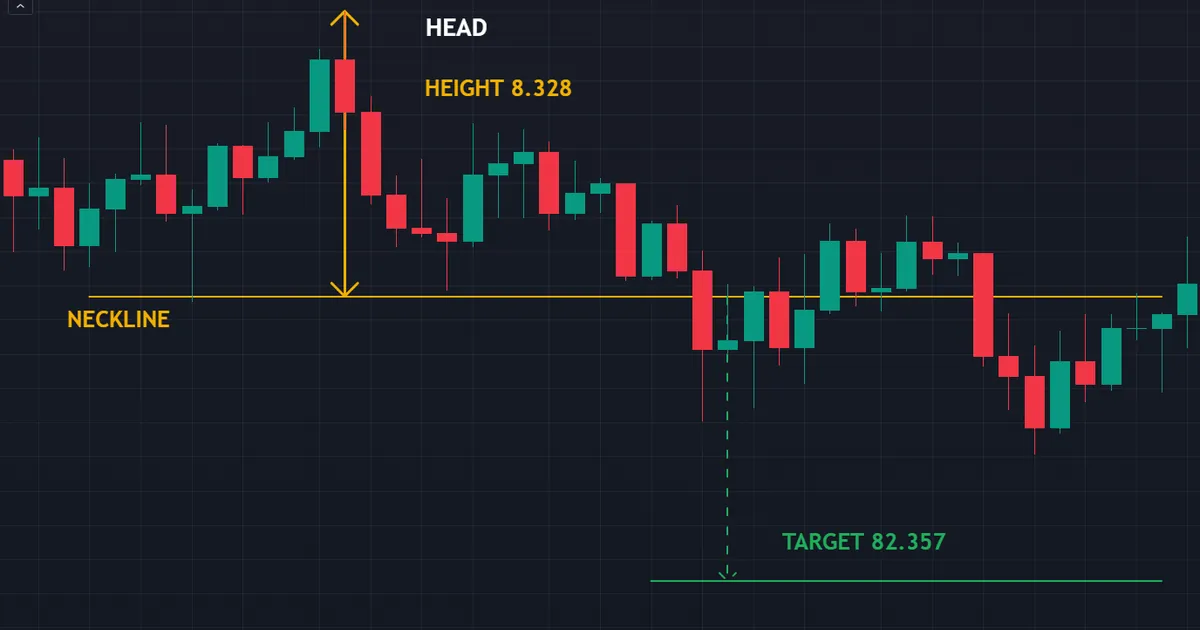
The chart above tracks a head and shoulders on AUDJPY weekly bars. Its head sits at 99.013, the neckline runs at 90.685, and the gap between them comes to 8.328.
The Two Levels You Need
First comes the extreme. On a head and shoulders that means the head, on a double bottom the pair of lows, and on a triangle the widest part of the shape.
Next comes the confirmation level. That means the neckline, the trigger line, or whichever boundary price must close beyond to complete the pattern.
Subtract one from the other and the height falls out. AUDJPY gives 99.013 minus 90.685, or 8.328 in yen terms.
Where the Projection Starts
Always project from the confirmation level, never from your fill. The shape defines that level, while your fill depends on how quickly you clicked.
So the AUDJPY target lands at 90.685 minus 8.328, which comes to 82.357. Anyone measuring the same shape arrives at the same number.
Repeatability matters more here than precision. A target you can reproduce next month beats one you nudged to fit a chart you already liked.
Why the Height Works as a Rough Proxy
Think about what the shape records. Buyers and sellers fought across a certain range for a certain number of bars, and both sides built positions inside it.
Once price leaves that range, the losing side has to cover. Their exits push in the breakout direction, and the range they were trapped in scales the pressure.
That story explains the convention without proving it. Treat the height as a sensible first estimate, then let the chart in front of you adjust it.
What the Projection Cannot Tell You
A target says nothing about timing. Price might cover the distance in three bars or grind toward it for two months, and the arithmetic makes no distinction.
It also says nothing about the path. A move can dip through your stop, recover, and then reach the projection without you, which counts as a loss whatever the chart shows later.
So treat the number as one input among several. Position size, stop placement and holding period all decide the outcome long before the projection matters.
How to Set a Measured Move Target, Step by Step
Run the same six steps every time. Consistency here matters far more than any clever variation.
- Wait for the close. A wick through the confirmation level completes nothing, so no measurement starts yet.
- Mark the extreme. Note the head, the pair of lows, or the widest point of the shape.
- Mark the confirmation level. Draw it horizontally and leave it where the pattern put it.
- Subtract for the height. The distance between those two levels becomes your projection unit.
- Project from the level. Add the height above a bullish break, or subtract it below a bearish one.
- Map the obstacles. List every old swing, round number and session extreme sitting in the way.
Step one rejects most candidates, which is exactly its job. Because price pokes through levels constantly, the close carries the information and the wick almost never does.

Keep that order fixed. Traders who measure the target before the break talk themselves into trades the chart never offered them.
How the Projection Behaves in Practice
Now for the part most guides skip. A measured move describes what a pattern might deliver, not what it owes you.
Price Frequently Stops Short
Partial follow-through is ordinary behaviour. A break can run two thirds of the projected distance, stall, and then hand the whole move back over the following sessions.
That outcome is not a failure of the pattern. The shape gave a trigger, an invalidation level and a direction, and it delivered on all three.
So plan for the short version from the outset. Booking a slice before the full projection turns a partial move into a paid trade rather than a story about one.
Obstacles Sit Between Entry and Target
Charts are crowded places. Old swing highs, round numbers, weekly opens and prior session extremes all attract orders long before your projection arrives.
Mark those levels first, then decide which one deserves a partial exit. Our support and resistance indicators archive collects the tools that draw them consistently.
An obstacle sitting just under the target changes the whole trade. Taking most of the position there beats holding for a few extra pips you may never see.
Sometimes It Overshoots Badly
Overshoots happen too, and they cost more than people admit. A trader who exits at the projection watches the move continue for twice the distance without them.
Leave a runner on if your plan allows one. A small remaining position with a trailing stop captures the outliers without risking the money you already booked.
Either way, decide in advance. Choosing between a full exit and a runner while price is moving produces the worst version of both.
Time Matters as Much as Distance
Two trades can share a projection and behave nothing alike. One covers the ground in a single session, while the other drifts sideways for weeks first.
Slow progress carries a real cost. Swap charges accumulate, your attention drains, and capital sits tied up in a position doing very little.
Set a time limit alongside the price target. If a four-hour shape has gone nowhere after twenty bars, the read has quietly expired whatever the level still says.
How Each Pattern Family Supplies Its Height
The method never changes, but the anchor does. Each family measures a different part of the structure, and mixing them up produces targets that make no sense.
Reversal Shapes
Head and shoulders, double tops and double bottoms all measure the same way. Take the extreme, take the neckline, and use the distance between them.
The AUDJPY example follows exactly that rule. Head at 99.013, neckline at 90.685, height of 8.328, projected down from the line.
Triple tops and bottoms behave identically. Three touches instead of two change the story a little, though the arithmetic stays untouched.
Continuation Shapes
Flags and pennants break the pattern most often. Their height comes from the flagpole that preceded them, not from the small consolidation itself.
Measure the pole from its base to its tip. Then project that full distance from the point where price leaves the flag.
Newer traders regularly measure the flag instead. Doing so produces a target so close that costs alone can swallow the entire move.
Triangles and Wedges
Triangles use their widest part. Measure the vertical distance at the left edge of the structure, where the two boundaries sit furthest apart.
Project that width from the breakout point. Some traders instead run a line parallel to the flatter boundary, which gives a similar answer on most charts.
Wedges resist clean measurement altogether. Many traders skip the projection there and simply target the origin of the wedge instead.
Channels and Ranges
A range gives the tidiest height of all. Take the distance between the floor and the ceiling, then project it from whichever side gives way.
Channels work the same way with sloping boundaries. Measure the channel width, then apply it from the break point in the direction of travel.
Both cases reward patience over speed. Ranges produce false breaks constantly, so the close beyond the boundary earns its place in the routine.
A Worked Example on Four-Hour Bars
Weekly shapes teach the concept, though most traders work faster charts. So here is the identical arithmetic on a four-hour double bottom.

Running the Numbers
The chart above shows EURJPY four-hour bars with two lows at 186.046. A neckline runs across the peak between them at 186.738.
Subtract the lows from the neckline and the height comes to 0.692, or roughly 69 pips. Add that distance above the line and the target lands near 187.430.
Notice how small the numbers look beside the weekly example. Same method, different scale, and a completely different cost profile.
Checking the Target Against the Stop
A target means nothing on its own. Compare it with the stop before you commit anything to the trade.
Here the stop belongs below the second low, so the risk runs a little over 69 pips. That puts the reward close to one to one before costs.
Run those figures through our risk reward calculator before entering. Our guide to the risk reward ratio covers what to do when the numbers disappoint you.
Comparing the Two Examples
Set the weekly shape beside the four-hour one. AUDJPY offered 8.328 of room while EURJPY offered 0.692, and both used the identical method.
Holding periods differ just as sharply. A weekly projection can take months to resolve, while a four-hour one often resolves inside a week.
Pick the scale that matches your patience. A target you cannot sit with gets closed early whatever the arithmetic said.
Where Costs Bite Hardest
Spread consumes a fixed slice of every move. On a 69 pip projection a two pip spread eats close to three percent of the whole target.
The weekly AUDJPY shape faced the same spread across 8.328 yen. Costs barely register at that scale, which is why larger patterns forgive sloppier execution.
So match the pattern size to your cost base. Small shapes on expensive pairs rarely leave enough room to matter.
Deciding Where the Partial Exit Goes
Look at the space between 186.738 and 187.430 before entering. Any prior swing high inside that range becomes a candidate for the first exit.
Round numbers deserve the same treatment. A level like 187.000 sits directly in the path here, and orders cluster around figures like that.
Split the position across both. Half booked at the obstacle and half held for the projection removes most of the guesswork from the middle of the trade.
Download the complete indicator database
Put these concepts on your charts. One email unlocks the full library of 1,380+ indicators with compiled MT4 and MT5 files, plus my TradingView scripts. No paywall, no spam, unsubscribe any time.
Get free access to my indicator database
One email unlocks 1,380+ free MT4, MT5 and TradingView indicators — the complete library. No single-tool download; you get the whole database.
Common Measured Move Mistakes and the Fixes
Most damage around projections traces back to a short list of habits. Each one carries a fix that costs nothing beyond discipline.

Measuring From the Entry Price
Your fill has no place in the calculation. Take the height from the extreme to the confirmation level, then project from that level rather than from wherever the order landed.
The fix costs one extra second. Draw the projection on the chart before you place the order, and the fill can no longer contaminate it.
Redrawing the Confirmation Level
Sloping a neckline until a break appears defeats the whole exercise. Anchor the line where the shape puts it, then leave it alone whatever happens next.
Screenshot the chart once the line goes on. Later you can check whether the level you traded matches the level you drew.
Treating the Target as a Promise
Nothing obliges price to arrive. Log the projection as an estimate, mark the obstacles ahead of it, and take partial profit at the obvious ones.
Language shapes behaviour here. Traders who call it a target hold longer than traders who call it an estimate, and the second group tends to keep more.
Ignoring the Timeframe That Drew the Shape
A weekly pattern deserves a weekly close and a weekly measurement. Borrowing a five-minute chart for extra precision produces a tidier number and a worse trade.
Pick the chart first, then stay on it. Dropping down mid-trade almost always ends with an early exit you later regret.
Holding Through an Obvious Barrier
A major swing high sitting just below your target is a warning. Scale out there instead, because the projection carries no more weight than the level in front of it.
Ask which level has more history behind it. An old weekly high that stopped price three times outranks any number your arithmetic produced this morning.
Skipping the Record
Guesswork replaces evidence fast without notes. Log where price actually stopped in our trade journal, and your own numbers soon beat any general claim.
Record the fraction reached, not just the outcome. After thirty trades you will know roughly how far your patterns travel on your instruments.
Measured Move Quick Reference
Keep this table beside your chart while the routine settles in. Each row states a condition rather than an outcome.
| Element | What to check | Common practice |
|---|---|---|
| Trigger | A close beyond the confirmation level | Close on the timeframe that drew the shape |
| Extreme | Head, pair of lows, or widest point | Marked before the break, not after |
| Confirmation level | Neckline or trigger line, drawn flat | Never redrawn to suit the result |
| Height | Extreme minus confirmation level | Measured in price, not in bars |
| Projection | Height added or subtracted from the level | Logged as an estimate |
| Obstacles | Old swings, round numbers, session extremes | Listed before entry |
| Exits | Partial at the first barrier | Runner for the overshoot cases |
Notice what the table refuses to include. No column suggests how often the projection arrives, because that figure shifts with the market, the period and the definition applied.
Published testing of classical patterns has produced modest and inconsistent results. Two analysts applying different tolerances to one chart will even disagree about whether a shape formed.
When the Measured Move Never Arrives
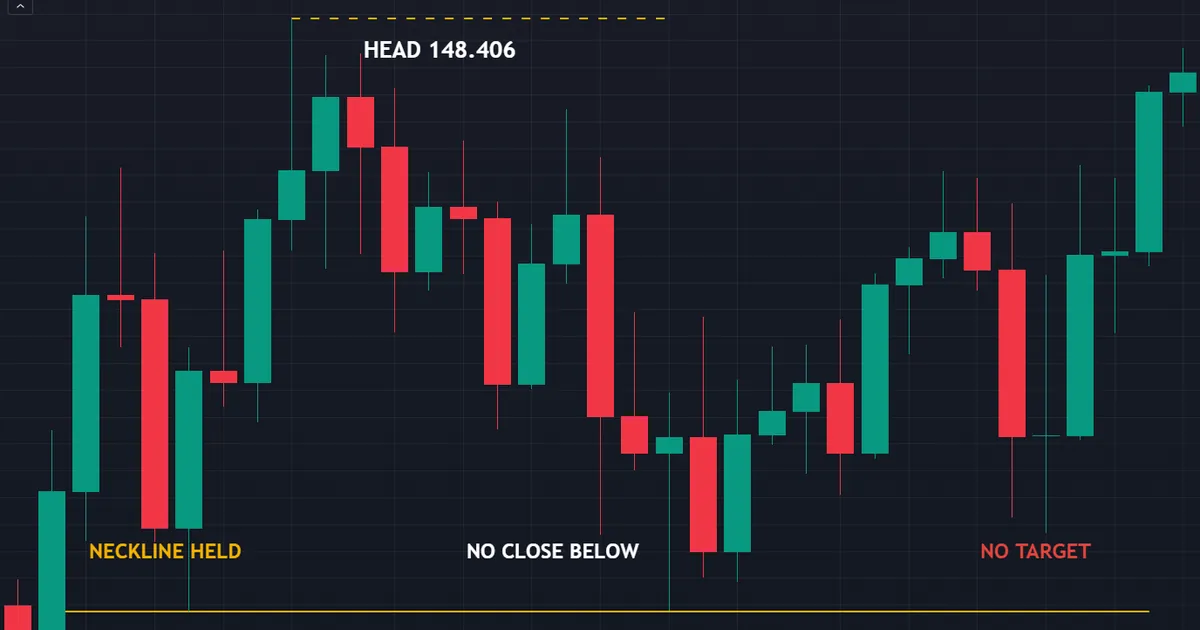
The neckline was never closed beyond — the pattern never triggered. That single sentence describes the most common ending for a projection, and it deserves far more attention than the clean cases.
The Shape Simply Expires
The chart above shows a head and shoulders on EURJPY weekly bars. Its head sits at 148.406 and the neckline runs at 137.3765, giving a height of 11.0295.
Multiply that out and the projection would have landed near 126.347. Price never closed under the neckline, though, so no trade existed and no target ever applied.
Traders who calculate the target early get attached to it. They then take the trade on a wick, or worse, without any break at all.
The Break Reverses Straight Back
A second ending runs faster. Price closes beyond the level, everyone measures the projection, and the next bar closes back inside the pattern.
That reversal invalidates the read immediately. Our guide to chart pattern failure covers how to trade the snap-back rather than argue with it.
The Move Runs Out of Room
Some projections point straight into a wall. A weekly target sitting inside a multi-year range floor faces every buyer who ever defended that area.
Check what occupies the space before you enter. Our ATR in trading guide helps you judge whether the distance is even plausible in the time you plan to hold.
The Pattern Was Too Small to Matter
Six-bar shapes on fast charts produce tiny heights. Spread and slippage then swallow a meaningful share of the projection before price moves anywhere.
Scale up until the height clears your costs comfortably. A projection worth taking should survive a bad fill and a widened spread without collapsing.
The Height Came From the Wrong Anchor
Plenty of failures start with a measurement error. A flag measured across the flag rather than the pole produces a target price would clear on any ordinary bar.
Check the anchor against the pattern family every time. Reversals use the extreme, continuations use the prior leg, and triangles use the widest point.
A quick sanity check catches most of these. If the target sits closer than a normal day’s range, you almost certainly measured the wrong thing.
Related Ideas to Study Next
Reversal shapes supply the clearest heights. Our guides to the head and shoulders pattern and the double bottom pattern walk through both structures in full.
Continuation shapes measure differently. Our guide to the flag pattern uses the flagpole rather than the flag itself as the projection unit, which trips up plenty of newer traders.
Detection tools help you find the shapes faster. Our pattern recognition indicators archive collects the ones that mark structures automatically on MT4 and MT5.
Automation has a clear limit, though. Software finds candidates quickly, yet you still decide which anchor belongs to which family and whether the level carries any history.
Volatility gives the last piece of context. A projection worth two average daily ranges asks for patience, while one worth a quarter of a range may not clear your costs at all.
One habit outranks all of this arithmetic. Time spent drawing honest levels pays back faster than time spent refining projections, because a target sitting in open space means far less than one resting against real history.
FAQ
What are measured move targets?
They project a chart pattern’s own height beyond the level that confirmed it. Measure from the pattern extreme to the confirmation level, then add or subtract that distance from the level itself.
Do I measure from the extreme or from my entry?
Always from the extreme to the confirmation level. Your fill depends on execution speed and spread, so a target measured from it would differ for every trader looking at one chart.
How often does price reach the projection?
No dependable figure exists, and any article quoting one has picked a definition to suit it. Published testing of classical patterns shows modest and inconsistent results across markets and periods.
Should I take the whole position off at the target?
Many traders scale out instead. Booking a slice at the first real obstacle secures part of the move, while a small runner behind a trailing stop keeps you in the occasional overshoot.
What if the target sits behind a major level?
Treat the level as the working target instead. An old weekly high that has stopped price several times carries more history than any projection you calculated this morning, so most traders book the bulk of the position there.
Does the method change between patterns?
The principle holds, though the measurement anchor moves. Reversal shapes use the extreme to the neckline, flags use the flagpole, and triangles use the widest part of the structure.
Are measured moves useful on lower timeframes?
They work anywhere the height clears your costs. On fast charts the projection often shrinks to a handful of pips, so spread and slippage claim a large share of it before price travels far. Test the idea on your own instruments, keep a record of where price actually stopped, and size every trade so a short move stays survivable. Results are not guaranteed; past performance is not indicative of future results.
External references
- For background on this concept, see Measured Move Bearish at StockCharts ChartSchool.
- For broader market context, see Price Target at Investopedia.

About the author
Written by Dominic Walsh, a Forex trader and MT4/MT5 indicator, Expert Advisor and script developer. Every tool on forexmt4systems.com is tested on live charts before release and ships with ready-to-use compiled MT4 (.ex4) and MT5 (.ex5) files. Learn more about the trader and developer behind this site.
How we build, test and correct every tool: Editorial & Testing Policy. Trading carries risk; see the disclaimer.