
Impulses look tidy on a chart. Elliott wave corrective patterns rarely do, and that gap causes most of the frustration traders feel with wave analysis.
This guide covers the three core shapes and the combinations built from them. Zigzags, flats and triangles account for the bulk of what you meet, though naming one while it forms remains the hardest job in the whole framework.
So take the honest position from the start. Analysts label the same pullback differently, everybody revises a corrective count as fresh price arrives, and a shape only becomes obvious once it has finished.
What Elliott Wave Corrective Patterns Are
A correction moves against the larger trend. Elliott described it as a three-part structure rather than the five-part impulse that precedes it.
Label the parts A, B and C. Wave A starts the pullback, wave B recovers part of it, and wave C finishes the job.
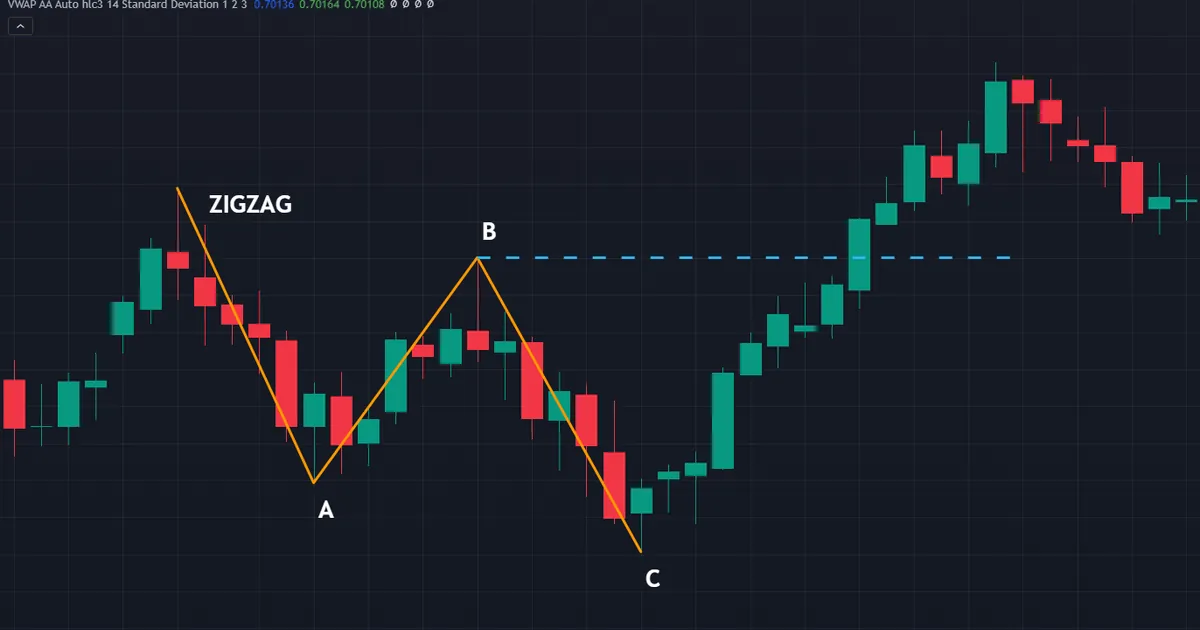
Above sits a clear example. The AUDUSD daily chart carries a three-wave decline labelled as a zigzag, with a deep B leg that recovers about 77 percent of wave A before wave C runs almost exactly wave A’s distance.
Three Legs, Not Five
Leg count separates the two families. Five legs against the trend suggest something larger has begun, while three legs suggest a pause.
That distinction sounds simple and rarely feels it. Overlapping swings inside a correction hide the leg boundaries, so two analysts count four legs and six legs on the same chart.
Our Elliott wave theory guide covers the five-three cycle in general terms. This page goes deep on the three-part half.
Why Corrections Take So Long
Time behaves oddly here. A correction frequently consumes more calendar than the impulse it follows, even when it covers less ground.
Sideways drift explains most of that. Buyers and sellers pass control back and forth without resolving anything, which produces overlap instead of progress.
Patience therefore beats prediction. Traders who expect a quick pullback often sit through weeks of chop and abandon the idea near the end.
How Deep They Usually Run
Elliott left one handy landmark. Corrections often end inside the range of the fourth wave of the next smaller degree.
Mark that range on your chart. It gives you a zone to watch rather than a number to trust.
Depth varies wildly beyond that. Some pullbacks give back a third of the prior move, and others take almost all of it.
So plan for the deep case. A stop placed just under a shallow retracement gets taken out by ordinary noise.
How to Classify a Correction, Step by Step
Work through a fixed order. The sequence below keeps you from naming a shape before the chart supports one.
- Confirm the trend it corrects. Identify the impulse that came first, because a correction only makes sense against something.
- Count the legs. Three suggests a correction, five suggests a new impulse, and anything unclear suggests waiting.
- Measure wave B against wave A. The depth of that recovery does more to name the shape than any other single reading.
- Check whether wave C exceeds wave A’s end. That answer separates the regular shapes from the running variants.
- Look at the subdivisions. A five-part wave A points toward a zigzag; a three-part wave A points toward a flat or a triangle.
- Write what would prove you wrong. Note the price that ends the corrective reading entirely.
Step six earns the most. Without it, a correction label stretches to cover any outcome, which makes it useless as a plan.

Resist naming the shape early. Most misreadings start with a trader who decided on a flat before wave B had even finished.
The Zigzag
Zigzags cut. They travel sharply against the trend and give back a meaningful slice of the previous move.
The 5-3-5 Subdivision
Internal structure defines the shape. Wave A splits into five legs, wave B into three, and wave C into five again.
That five-part wave A matters most. It tells you early that the pullback carries more force than a sideways shape would.
Wave B stays contained. It never trades beyond the start of wave A, and most zigzag B legs recover somewhere between a third and two thirds of it.
Where Zigzags Show Up
Wave two hosts them frequently. Sentiment sours quickly after a first push, and price drops hard enough to convince everybody the old trend has died.
Wave A of a larger correction hosts them too. A sharp opening leg often warns that the whole pullback will run deeper than a drift.
Double zigzags exist as well. Two zigzags join through a connecting wave, which stretches the correction without changing its character.
Reading Wave C in a Zigzag
Wave C frequently runs a similar distance to wave A. Traders watch that relationship as a rough landing zone rather than as a price that must print.
An extended wave C happens often enough to plan for. Roughly 162 percent of wave A appears regularly, and our page on Elliott wave Fibonacci targets covers those relationships properly.
Neither figure carries any obligation. Price stops short of both zones about as readily as it reaches them.
Zigzag or the Start of Something Larger
Sharp moves raise an awkward question. A five-part wave A can also count as wave one of a brand new impulse.
Both readings fit the same early bars. Only later price separates them, which is why a single confident label so often ages badly.
So rank the two and move on. Note the price that favours each, then let the market pick rather than arguing with it.
Position size settles the rest. Half a position costs little while the structure clarifies itself.
The Flat
Flats drift. They move sideways at roughly the same level and frustrate anyone waiting for a decisive pullback.
The 3-3-5 Subdivision
Count the legs inside each part. Wave A splits into three, wave B into three, and wave C into five.
The three-part wave A gives the shape away. A pullback whose opening leg refuses to divide into five rarely turns into a zigzag.
Wave B recovers most of wave A here. Depth near 90 percent or beyond marks the flat family clearly, which is why the B leg does so much of the classification work.
Regular, Expanded and Running Flats
Three variants appear in the textbooks. A regular flat sees wave B stop near wave A’s origin and wave C finish just past wave A’s end.
An expanded flat pushes further. Wave B trades beyond wave A’s start, then wave C overshoots wave A’s end, which traps traders on both sides in turn.
A running flat falls short instead. Wave B exceeds wave A’s start, yet wave C fails to reach wave A’s end, leaving a correction that barely gives ground.
Expanded flats cause the most damage. The false break in wave B looks exactly like a trend resumption until wave C arrives.
Trading Around a Flat
Flats reward patience over prediction. Nothing about the middle of a sideways correction offers a decent trade for most retail approaches.
Mark the boundaries instead. The extremes of waves A and B give you a range, and price leaving that range tells you more than any label.
Our page on divergence in trading covers one of the readings traders use as the correction matures.
The Triangle
Triangles contract. Five legs converge between two boundary lines while the market decides very little.
Five Legs, Each in Three
Label the legs A, B, C, D and E. Each one subdivides into three, which makes the whole structure corrective from top to bottom.
Contraction defines the standard case. Highs fall and lows rise, so the range narrows leg by leg toward the apex.
Variants exist too. Barrier triangles keep one boundary flat, and expanding triangles widen rather than narrow, though both appear far less often.
Where Triangles Sit in a Count
Position carries information here. Triangles turn up most commonly in wave four and in wave B, which places them immediately before the final leg of the larger structure.
Treat that as context, not as a signal. A triangle in wave four suggests one more push remains, and price still owes you nothing.
Our guide to triangle pattern types covers the classical chart-pattern versions, which look similar and carry different assumptions.
The Thrust After a Triangle
Textbooks describe a sharp move once the triangle resolves. Practitioners often measure the widest part of the structure and project it from the break.
Treat that projection loosely. Price frequently stops short, which is precisely why partial exits exist.
False breaks appear regularly as well. A single close outside the boundary that immediately reverses tells you the contraction has more work to do.
Triangles on Currency Charts
Spot forex suits triangles well. Trading runs around the clock, so the boundary lines rarely get broken by an opening gap.
Session rhythm still matters. Many contractions form through quiet Asian hours and resolve when London arrives with real volume.
Watch the calendar too. A triangle sitting into a major data release often breaks on the news rather than on the structure.
Neither observation predicts direction. They simply tell you when the range is likely to end.
Combinations
Sometimes one shape refuses to finish the job. Elliott allowed corrective structures to join together, which produces the messiest charts in the framework.
Doubles and Triples
Two corrections can link into a double. Three can link into a triple, though that reading demands real caution because it explains almost anything.
Combinations usually mix character. A sharp zigzag joins a sideways flat, which satisfies the alternation habit analysts look for.
Duration stretches accordingly. A combination can consume months of chart while covering very little ground in price.
The Connecting Wave
An X wave joins the parts. It runs counter to the correction, and it subdivides into three like everything else in this family.
Length varies enormously. Some X waves barely register, while others recover most of the first correction and look like a trend of their own.
Keep the combination label as a last resort. Reaching for it early gives you a story that survives any price action, which defeats the purpose of counting.
A Worked Correction on the Weekly Chart
Real charts settle the theory faster than diagrams do. Consider the EURUSD weekly decline that ran from late March 2022 into July of that year.
Three legs carry the move. Wave A drops, wave B recovers, then wave C completes the structure.
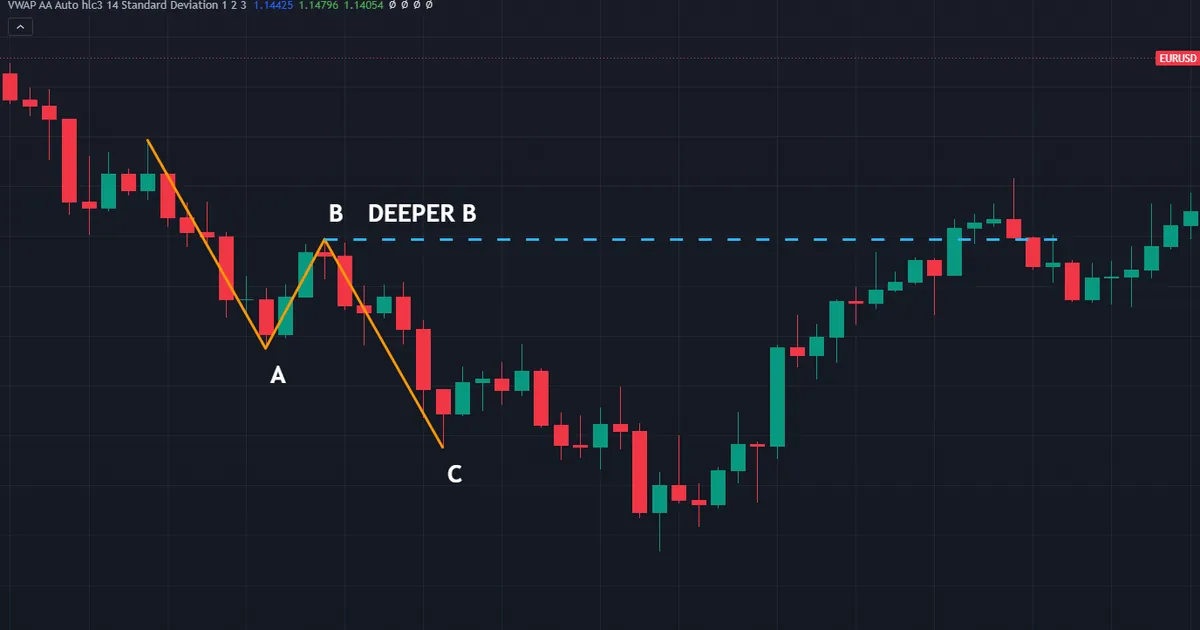
The image flags the B leg deliberately, because its depth does most of the classification work. Wave B recovers about 52 percent of wave A, then wave C runs almost exactly wave A’s distance.
What That Reading Implies
A B leg near half of wave A sits comfortably inside zigzag territory. A flat would demand a much deeper recovery, closer to 90 percent.
Wave C matching wave A adds support. That equality shows up often enough across corrective structures to notice, without ever carrying an obligation.
Compare it with the AUDUSD example above. There the B leg recovered about 77 percent, which sits deeper and makes the classification less comfortable.
Turning the Reading Into Risk
Take the entry from a level rather than a label. The end of wave C sits near something visible in most cases, and that price defines your stop.
Then size the position from that distance. Our free ATR position size calculator converts a volatility-based stop into a lot size before you commit.
Write the invalidation number in the same note. A correction label without a price attached quietly survives every outcome.
Download the complete indicator database
Put these concepts on your charts. One email unlocks the full library of 1,380+ indicators with compiled MT4 and MT5 files, plus my TradingView scripts. No paywall, no spam, unsubscribe any time.
Get free access to my indicator database
One email unlocks 1,380+ free MT4, MT5 and TradingView indicators — the complete library. No single-tool download; you get the whole database.
Telling the Three Shapes Apart
One reading does most of the work. The depth of wave B separates the families faster than any other measurement.
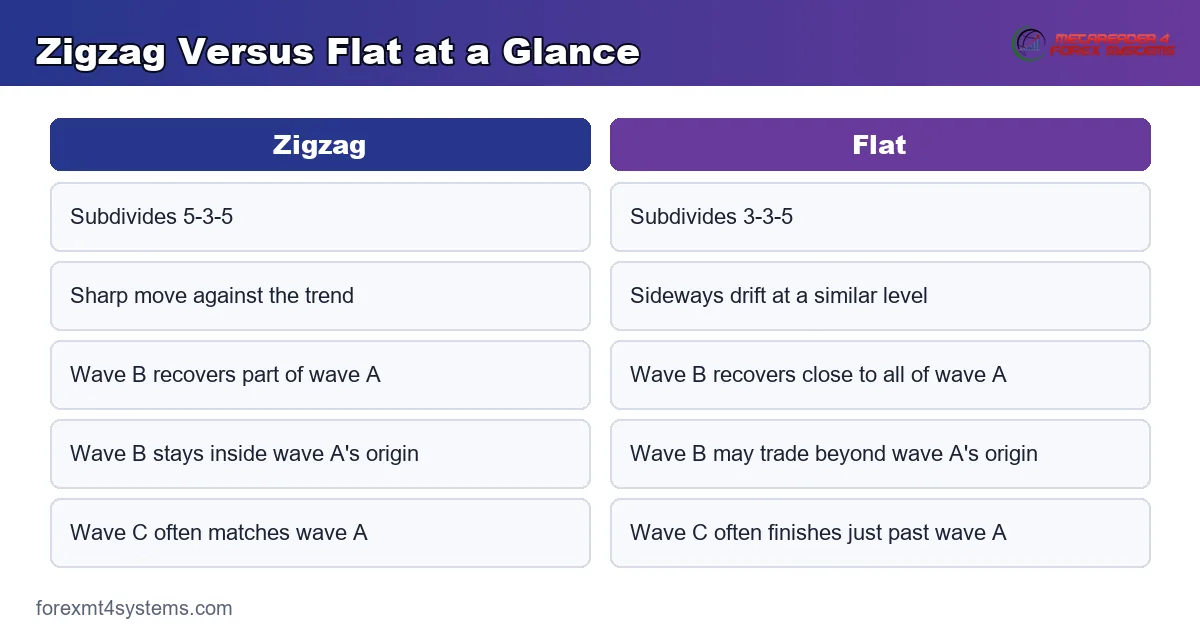
The B-Leg Test
Shallow to moderate B legs point toward a zigzag. Deep B legs, near or beyond wave A’s origin, point toward the flat family.
Then confirm with the subdivisions. A five-part wave A supports the zigzag reading, while a three-part wave A supports a flat or a triangle.
Triangles announce themselves differently. Once you see five overlapping legs inside converging boundaries, the other two shapes stop fitting.
What the Test Cannot Settle
Early corrections resist every method. Until wave B completes, the depth reading you need simply does not exist yet.
So hold two labels while the structure builds. Our guide on how to use Elliott wave counts covers writing a preferred reading with an alternate beside it.
Then let price choose. Corrections reveal themselves at the end, and no amount of measuring accelerates that.
Common Mistakes Labelling Corrections
Six habits explain most botched corrective counts. Each one has a straightforward fix.
Naming the Shape Too Early
A label chosen before wave B finishes rests on nothing. Wait for the B leg to complete, then measure it against wave A.
Expecting a Quick Pullback
Corrections routinely outlast the impulse before them. Plan for time as well as price, and avoid tying up capital in a structure that may drift for weeks.
Reaching for a Combination
The double and triple labels explain anything, which makes them dangerous. Exhaust the simple readings first, and treat combinations as a last resort.
Trading the Middle
Sideways corrective structure offers poor risk for most approaches. Wait for the boundary break, or trade something else while the shape develops.
Ignoring the Expanded Flat
Wave B pushing past wave A’s start looks exactly like a trend resumption. Mark wave A’s origin on the chart, and treat a break of it as a warning rather than a confirmation.
Skipping the Invalidation Price
A corrective label with no number attached survives any outcome. Write the price that ends the reading before you place an order.
Corrective Pattern Quick Reference
Keep this table beside the chart while the vocabulary settles. The middle column carries the reading that names the shape.
| Shape | Subdivision | What wave B does |
|---|---|---|
| Zigzag | 5-3-5, sharp | Recovers part of wave A, stays inside its origin |
| Double zigzag | Two zigzags plus a connector | Same character twice, stretched in time |
| Regular flat | 3-3-5, sideways | Recovers close to all of wave A |
| Expanded flat | 3-3-5, sideways | Trades beyond wave A’s origin, then wave C overshoots |
| Running flat | 3-3-5, sideways | Trades beyond wave A’s origin, then wave C falls short |
| Contracting triangle | Five legs, each in three | Part of a narrowing range rather than a retracement |
| Combination | Two or three shapes plus X waves | Mixes sharp and sideways character |
Read the right column first. Wave B does more classification work than anything else on the chart.
When the Label Was Simply Wrong
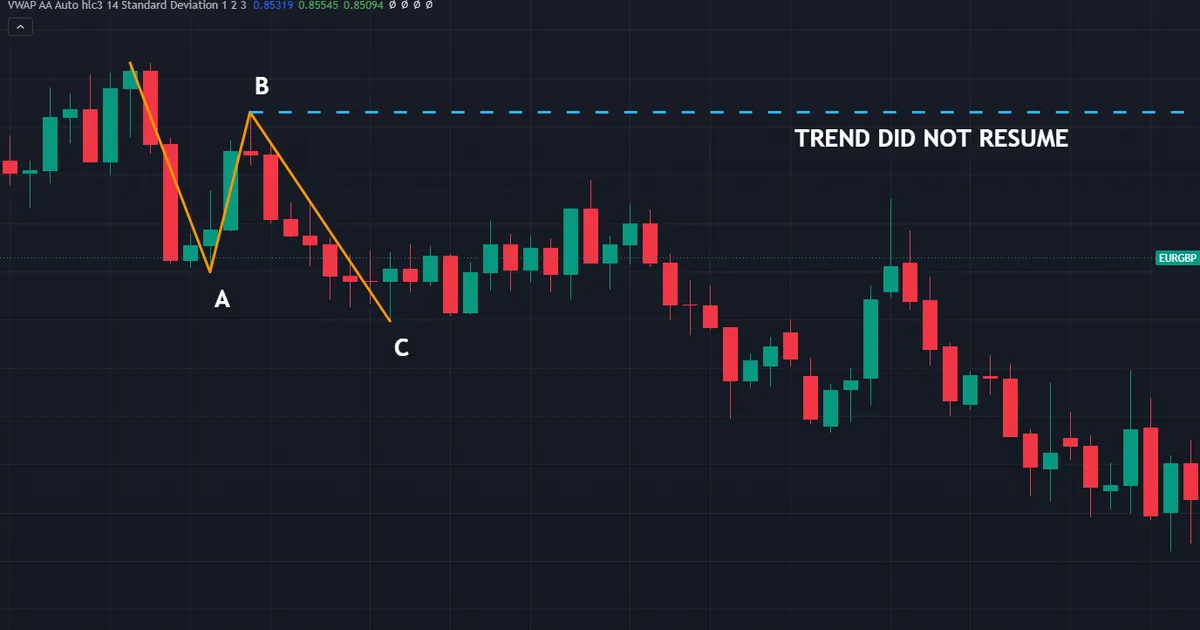
Corrective readings fail in a specific way. The three legs complete tidily, and the trend they supposedly corrected never comes back.
Reading the EURGBP Case
The chart above covers EURGBP on the weekly timeframe. A three-wave decline completes with wave B recovering about 76 percent of wave A and wave C matching wave A’s distance.
Wave C bottomed at 0.84984 in February 2024. Price then drifted between roughly 0.848 and 0.865 for close to four months, and wave B’s 0.87149 high stayed unclaimed for over a year.
Everything looked textbook. Even so, the earlier trend never resumed on any useful horizon, so the correction label had to change.
That outcome teaches the core lesson. A completed three-wave move proves nothing about what follows it, whatever the ratios looked like on the way down.
What to Do About It
Treat the end of a correction as a place to look, not as a trigger. Wait for price to confirm the turn with structure you can see.
Keep the alternate reading live. Three legs can begin a larger five-wave move, which flips the whole interpretation.
Then protect the position with a level. The extreme of wave C gives you a concrete line, and a close beyond it ends the argument.
Grading Corrective Calls
Keep a dated note of every corrective label. Record the shape you chose, the alternate you ranked second, and the price separating them.
Review the file monthly. Most traders discover they name flats too readily, because a sideways drift feels safer than admitting the trend has turned.
That record beats any textbook. It shows exactly where your own reading drifts when a position runs against you.
Related Concepts Worth Studying Next
Rules come first if you have not covered them. Our page on the three Elliott wave rules separates the hard conditions from the softer guidelines.
Tooling helps with the drawing work. The Elliott wave indicators archive collects labelling tools, and the pattern recognition indicators archive covers automatic structure detection more broadly.
Check every automatic label yourself. Each tool bakes in one interpretation, and corrections are exactly where interpretations diverge.
FAQ
What are the main elliott wave corrective patterns?
Zigzags, flats and triangles cover the core family. Zigzags subdivide 5-3-5 and move sharply, flats subdivide 3-3-5 and drift sideways, and triangles run five overlapping legs inside converging boundaries. Combinations join two or three of these through connecting waves.
How do I tell a zigzag from a flat?
Measure wave B against wave A. A shallow to moderate recovery points toward a zigzag, while a recovery near or beyond wave A’s origin points toward a flat. Confirm with the subdivisions: five legs inside wave A supports the zigzag reading.
Why are corrections harder to count than impulses?
Overlap hides the leg boundaries. Corrective swings trade back through each other, so the turning points that define the count stay ambiguous until the structure finishes. Several shapes also fit the same early price action, which is why analysts disagree so often here.
What is an expanded flat?
A flat where wave B trades beyond the start of wave A, after which wave C overshoots the end of wave A. The false break during wave B looks like a trend resumption, which traps traders in both directions before the structure completes.
Where do triangles usually appear?
Most often in wave four of an impulse and in wave B of a correction. Both positions sit immediately before the final leg of the larger structure, so a triangle suggests one more push remains rather than a completed move.
How long does a correction usually last?
Often longer than the impulse before it. Sideways structures pass control back and forth without resolving, so calendar time stretches while price barely moves. Plan for time as well as for price when you hold a position through one.
What is an X wave?
A connecting wave that joins two corrective structures into a combination. It runs against the correction and subdivides into three legs. Length varies a great deal, and some X waves recover most of the first structure before the second one begins.
Can I trade a correction while it forms?
Some traders work the boundaries of a triangle or a flat, though the risk suits experienced hands rather than beginners. Waiting for the structure to complete and for price to confirm a turn keeps the decision simpler. Whichever route you choose, define the invalidation price first and size the position from your stop distance. Results are not guaranteed; past performance is not indicative of future results.
External references
- For background on this concept, see Sideways Market at Investopedia.
- For broader market context, see Impulse Wave Pattern at Corporate Finance Institute.

About the author
Written by Dominic Walsh, a Forex trader and MT4/MT5 indicator, Expert Advisor and script developer. Every tool on forexmt4systems.com is tested on live charts before release and ships with ready-to-use compiled MT4 (.ex4) and MT5 (.ex5) files. Learn more about the trader and developer behind this site.
How we build, test and correct every tool: Editorial & Testing Policy. Trading carries risk; see the disclaimer.