
The MACD vs RSI question comes up fast, because both tools claim to measure momentum. One draws lines that swing around a zero level, and the other rides a bounded scale from 0 to 100. Yet they answer very different questions.
This guide settles the MACD vs RSI choice with plain rules. So by the end, you will know how each tool is built, what each one reads, and how to run them together without doubling your noise.
MACD vs RSI: How the Two Tools Differ
Both indicators live in a lower pane, and both track the pace of a move. There the likeness ends. The MACD reads the relationship between two moving averages, so it blends trend and momentum. Meanwhile the RSI reads the balance of recent gains and losses, so it stays a pure momentum gauge.
The MACD has no ceiling and no floor. Its line can drift as far as price stretches, which makes it strong at showing the power behind a trend. Because it never pins, it keeps giving information deep into a big move, long after a bounded tool would flatline.
The RSI lives inside fixed walls. It cannot rise past 100 or fall below 0, so it excels at flagging stretched conditions. Most traders watch the 70 and 30 marks for those extremes.
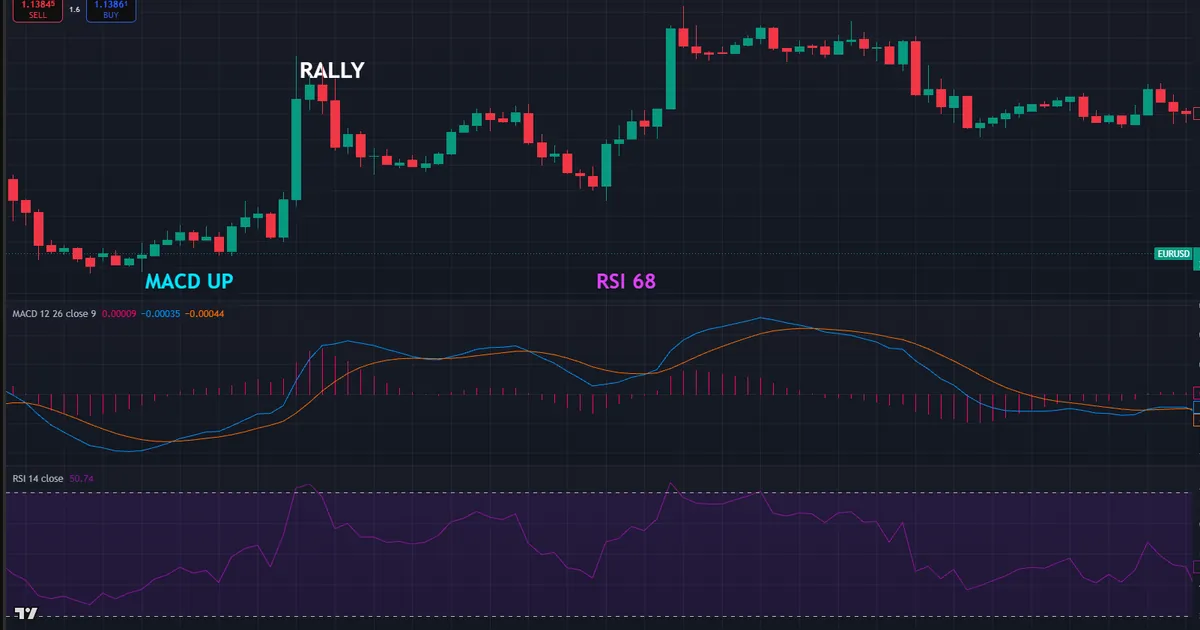
Look at a concrete case. The chart shows EURUSD on the one-hour timeframe with the MACD in one lower pane and a 14-period RSI in another. Price rallies near 1.14, the MACD histogram grows, and the RSI climbs toward 68. That single frame shows the two tools tracking the same push in different ways.
Force Versus Fatigue
Now trace the read from left to right. First both tools turn up as price lifts. Then the MACD line pulls away from its signal to show building strength, while the RSI simply reports how stretched the move has become. So one tool measures the force behind the move, and the other measures its fatigue near the extremes.
Why does this matter for real trades? Each tool shines in a different job. The MACD confirms a trend and times its shifts, while the RSI warns when a move runs hot. So the pair covers ground that neither one could ever cover alone. One tracks the force of the move, and the other tracks its natural limits.
How Each Tool Is Built
The math is small, so learn it once and reuse it forever. A few formulas separate these tools, and the rest follows from them.
- MACD line. Subtract the 26-period EMA from the 12-period EMA. The result rises when the fast average pulls above the slow one, and falls when it drops below.
- Signal line. Take a 9-period EMA of the MACD line itself. A cross between the two lines is the tool’s classic trigger.
- Histogram. Plot the gap between the MACD line and its signal as bars. Growing bars show momentum building, and shrinking bars show it fading.
- RSI ratio. Average the up-closes and down-closes over 14 bars, then map that ratio onto a 0 to 100 scale. A reading of 50 means gains and losses balance.
- RSI bounds. Because the scale is fixed, the RSI cannot run away with price. That design makes 70 and 30 meaningful across every pair.
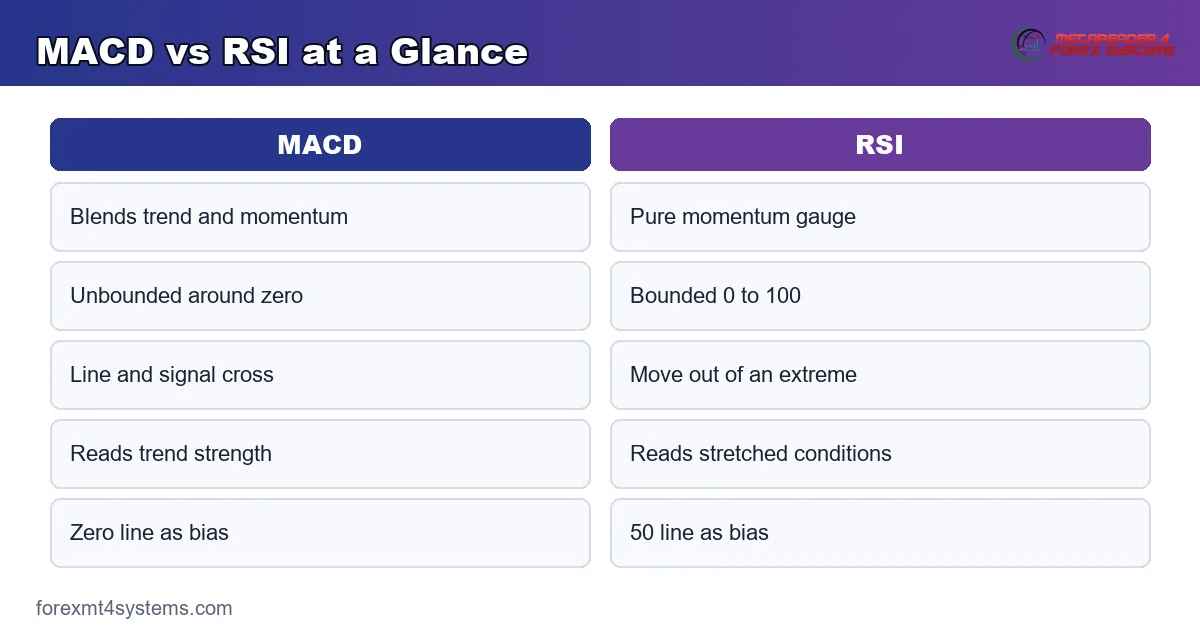
So the MACD is an unbounded blend of two averages, while the RSI is a bounded momentum ratio. The concept graphic below lines the two builds up side by side.
Reading the Zero Line and the Bounds
Each tool has a key level that anchors the read. On the MACD, that anchor is the zero line. A line above zero means the fast average leads, so the trend leans up. Below zero, the trend leans down.
On the RSI, the anchor is the 50 line. Price momentum above 50 favours buyers, and below 50 favours sellers. So both tools offer a simple bias filter, one through zero and one through the midpoint. Read that anchor first, and let the finer signals follow it.
Why the MACD Suits Trends
The MACD grows with a move, so it never caps out during a strong run. That freedom lets it show force building bar after bar. Because a trending market keeps the fast average ahead of the slow one, the MACD stays clearly on one side of zero.
The RSI behaves differently in the same trend. It can lock above 70 for hours and give no fresh signal. So in a powerful move, the MACD usually reads the strength better than the pinned RSI.
Why the RSI Suits Ranges
The RSI shines when price swings between two levels. Its fixed walls mean 70 and 30 mark real turning points in a range. So a poke into 30 near support often precedes a bounce back toward the top.
The MACD struggles in that same range. With no trend to ride, its line crosses back and forth around zero. Because the averages keep swapping places, the tool fires signal after signal that leads nowhere. So the two tools almost trade places between trends and ranges.
What the Overlap and the Gap Reveal
Both tools often agree, and that agreement carries weight. When the MACD turns up through zero as the RSI climbs off 40, buyers likely hold control. So a shared signal beats a lone one nearly every time.
The gap between them tells a story too. Sometimes the MACD keeps rising while the RSI stalls near 70. That split hints the trend still has force, yet the move is getting stretched. So the pair frames both the power and the risk in one glance.
Divergence on Each Tool
Divergence appears on both, and it means the same thing. Price makes a new high, but the tool makes a lower high. That gap warns that momentum is fading under the surface.
Read divergence as a caution, not a trigger. A gap can persist for many bars before price turns. So wait for a clear price signal, such as a broken swing low, before you act on any divergence.
The two tools can also confirm each other on divergence. When both the MACD and the RSI carve lower highs against a rising price, the warning grows louder. Because two gauges agree, the fading momentum looks more real than a lone signal would suggest.
Two Triggers, Two Jobs
The tools hand you different triggers. The MACD offers the line-cross and the zero-line cross, both tied to trend shifts. The RSI offers the move out of an extreme zone, tied to stretched conditions.
So match the trigger to the setup. Use the MACD cross to join a trend early, and use the RSI exit from oversold to time a pullback entry. Because each fires in a different context, they rarely crowd each other out.
The Histogram as an Early Read
The MACD histogram deserves its own attention. It measures the gap between the line and its signal, so it shifts before the two lines actually cross. That head start can warn you a move is fading a bar or two early.
Read the bars for their direction, not just their height. Bars that grow show momentum building in the current direction. Bars that shrink show it draining away, even while price still edges higher. So a topping histogram often pairs well with an overbought RSI to flag a tiring push.
Settings, Timeframes, and Pairing
Standard settings exist because traders watch them together. Self-fulfilling attention gives those numbers real weight.
The MACD defaults to 12, 26, and 9. Those periods suit swing trading on the four-hour and daily charts. The RSI defaults to 14 with 70 and 30 bounds, and it adapts well from the five-minute chart up to the weekly.
Match the tool to the job first. In a clean trend, lean on the MACD to stay with the move. In a range, lean on the RSI to fade the edges. So the market condition, not habit, should pick your lead tool.
Pairing the Two Together
Many traders run both at once and let each play a role. The MACD names the trend and its shifts, while the RSI flags when the move runs hot. So the trend tool sets direction and the momentum tool guards the entry.
Confirmation beats confusion here. When both agree, a signal carries more weight. When they split, size down or stand aside, since a disagreement often means the move lacks conviction.
Respecting the Session Clock
Also respect the clock. Both tools read cleanest inside the London window and the New York morning, roughly 2:00 to 5:00 a.m. and 8:00 to 11:00 a.m. New York time. Because liquidity thins in the Asian session, signals whip more and fail more often. So weigh the session before you trust either read.
Worked Example: A Trend Entry on EURUSD
Picture EURUSD basing near 1.132 after a pullback on the one-hour chart. The wider daily trend still points up. Both tools have cooled off during the dip, and price starts to firm.
Watch how the two tools behave. The RSI dips to about 38, then curls back above 40 as buyers return. Meanwhile the MACD line crosses up through its signal below zero, an early sign of a shift. The chart below marks that pair of signals.
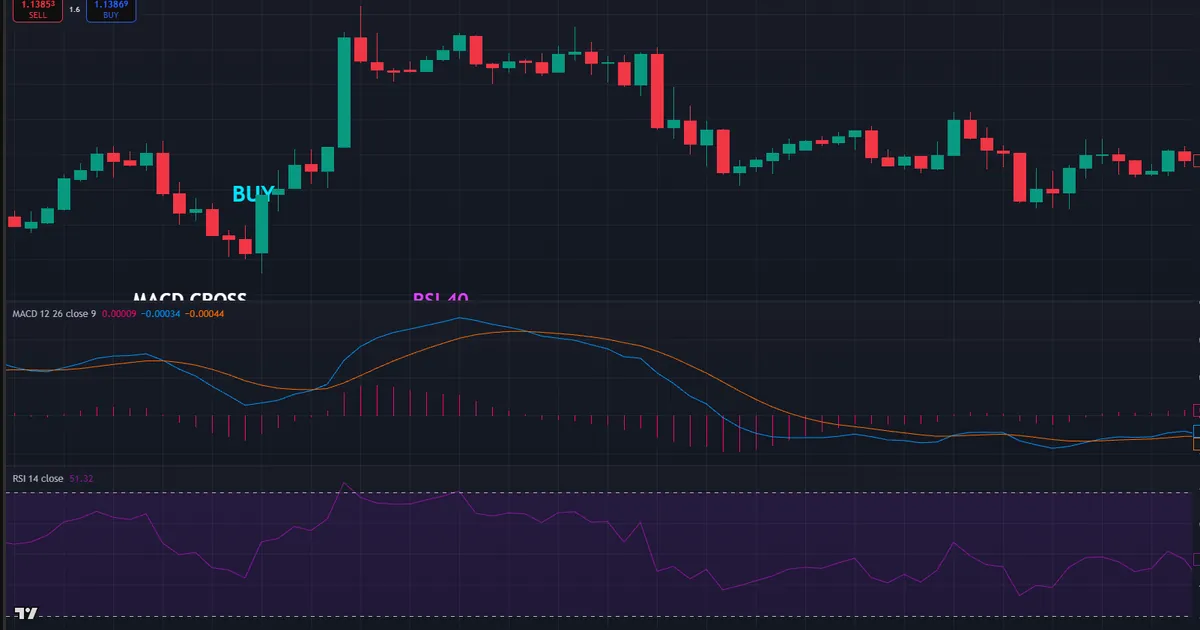
Now the trade builds itself. A trader buys as a bullish candle closes near 1.134, with a stop below the pullback low around 1.129. That places roughly 50 pips of risk on the trade. Because the RSI held above its oversold zone, the uptrend context stayed intact.
The follow-through rewarded the read. Price pushed toward 1.145, the MACD line climbed through zero, and the histogram grew. So the MACD confirmed the trend while the RSI kept the entry honest. That split of roles is a simple way to use both at once.
The stop placement flowed from structure, not from the tools. Price had held above 1.129 on the pullback, so that low made a clean line in the sand. Because the invalidation sat below a real swing, a normal wobble would not shake the trade out early.
Managing the Trade After Entry
A clean signal is only half the job. The exit decides the result. So plan a target before the trade goes live, and let the tools help you hold or fold.
In this EURUSD case, the growing histogram supports staying in the move. When the RSI later pokes above 70 and the histogram starts to shrink, you can trail the stop under the last swing. Because the trend still runs, an early exit often leaves pips behind.
What a Single-Tool Trader Missed
Notice the blind spots of using one tool alone. Someone on the RSI only would have seen a dull reading near 40 and skipped the setup. Meanwhile someone on the MACD only might have entered without a check on how stretched the prior move was. Because this trader used both, the entry stayed early yet still filtered.
Download the complete indicator database
Put these concepts on your charts. One email unlocks the full library of 1,380+ indicators with compiled MT4 and MT5 files, plus my TradingView scripts. No paywall, no spam, unsubscribe any time.
Get free access to my indicator database
One email unlocks 1,380+ free MT4, MT5 and TradingView indicators — the complete library. No single-tool download; you get the whole database.
Common Mistakes and How to Fix Them
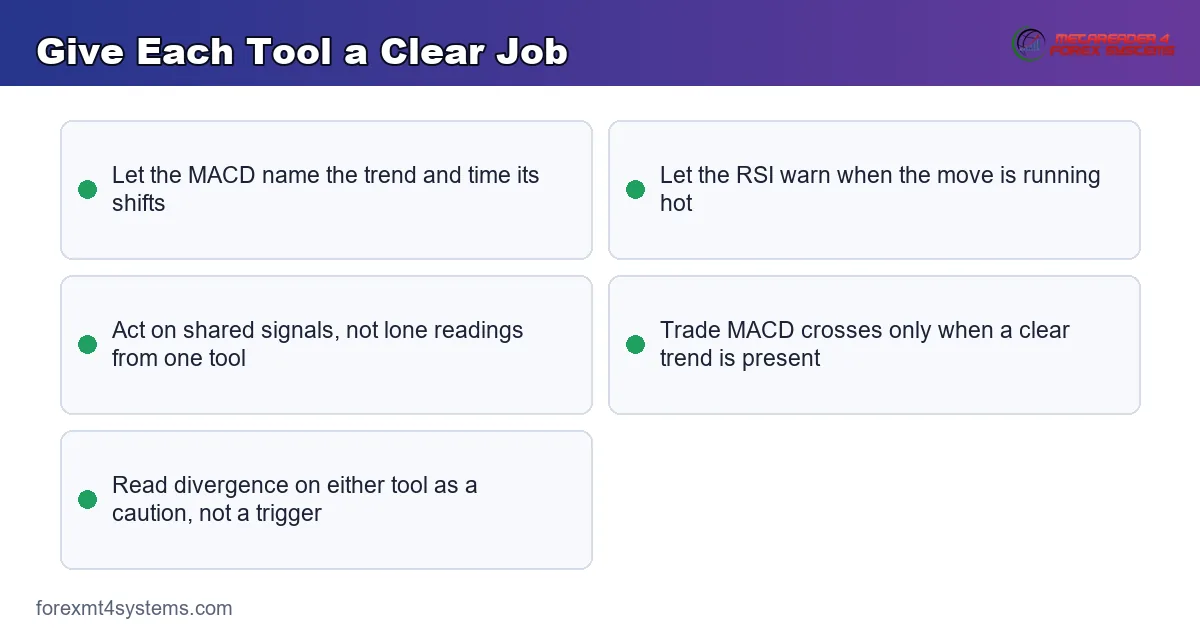
The tools are simple, yet the same errors repeat on every timeframe. Most trace back to using one tool for a job the other should do, and the fixes follow beneath the graphic.
Fading a Strong Trend on the RSI
An overbought RSI in a strong uptrend does not mean sell. Price can hold above 70 for a long stretch. So use the reading as a caution, and let the MACD confirm whether the trend still has force.
Trading Every MACD Cross
The MACD line crosses its signal often, and many crosses lead nowhere in a range. Acting on each one bleeds an account by small cuts. Instead, favour crosses that happen with the zero line and a clear trend behind them.
Treating the Two Tools as Twins
Running the MACD and RSI together only helps if each has a job. Reading them as duplicates doubles the noise. Instead, let the MACD lead on trend and the RSI guard the entry, so they complement rather than repeat.
Ignoring the Histogram
Many traders watch only the MACD cross and skip the histogram. Yet the bars show momentum shifting before the lines cross. So read a shrinking histogram as an early warning that a move is losing steam.
Forgetting the Higher Timeframe
A bullish MACD cross on the five-minute means little against a falling daily trend. Truly, the higher timeframe frames every lower-timeframe signal. So check the daily direction before you trust an intraday trigger.
Pre-Trade MACD and RSI Checklist
Run this short list before every entry. A few seconds here saves hours of regret later. So slow down, tick each item, and let a failed check keep you out of a marginal trade.
- Higher-timeframe trend read on the daily and four-hour charts.
- MACD position relative to zero, confirming the trend direction.
- RSI clear of the extreme zones, or leaving one in your favour.
- A defined trigger, such as a MACD cross with the trend.
- Stop distance set from the recent swing or a volatility read.
- An active session, London or New York, open now.
- Entry, stop, and target planned before the trade goes live.
When the Two Tools Fail
Study the failure case as hard as the winner. Here is a common one. EURUSD drifts sideways in a tight range on the fifteen-minute chart. A trader takes every MACD cross, sure each one starts a move.
Then the losses stack up. Each cross reverses within a few candles, and the histogram flips back and forth around zero. The RSI, meanwhile, hovers near 50 and offers no edge. The chart below shows that chop, with the whipsawing MACD marked inside the flat range.
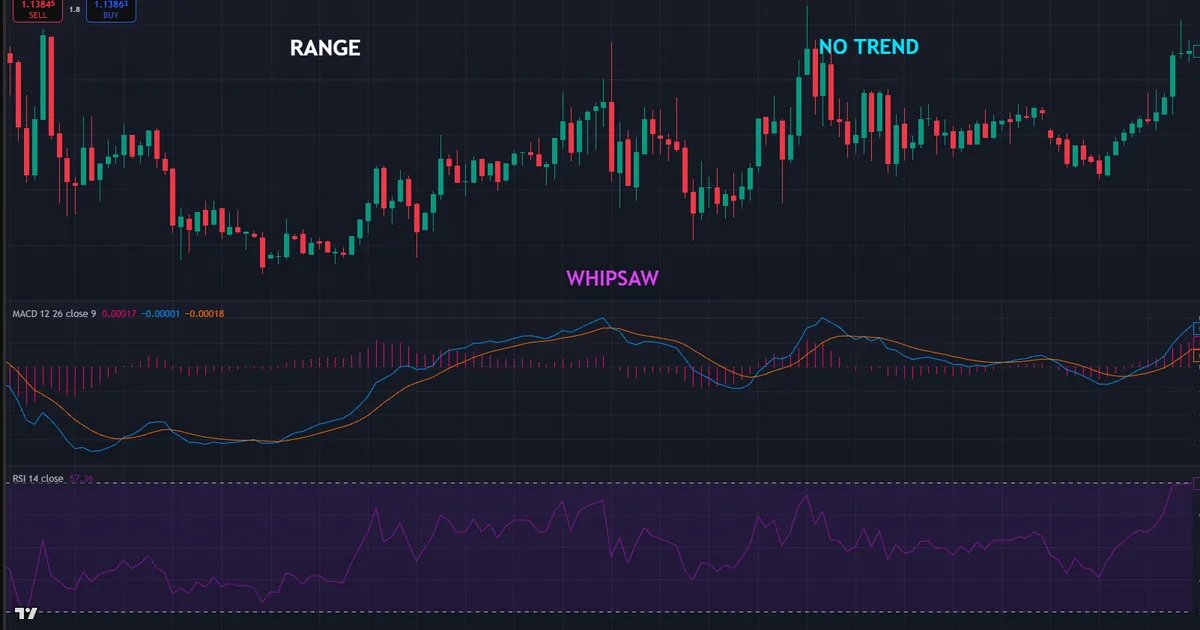
So what went wrong? The market had no trend, and the MACD is a trend tool at heart. In a flat range, its crosses fire constantly and lead nowhere. Hence the rule that limits the damage: trade MACD crosses only when a clear trend is present.
Then size each trade so a whipsaw costs little. A sensible stop flows from the range structure, and position size flows from that stop, which our free position size calculator works out in seconds. Because the risk stayed small, a string of false crosses stung rather than wounded.
Lag Cuts Into Every MACD Signal
Be honest about the built-in cost. The MACD is built from moving averages, so it lags price by design. In a fast reversal, that lag can hand back a chunk of the move. So pair the tool with a faster read, such as the RSI or a candle signal, to shave the delay.
The RSI Misleads in a Trend
Be honest about the RSI too. In a strong trend, it can lock at an extreme and give no useful signal. So do not wait on the RSI to leave 70 before you join a powerful uptrend. Let the MACD carry the read while the RSI stays pinned.
Neither Tool Sees the News
Be honest about a shared blind spot. Both tools read only past price, so neither one sees a rate decision or a jobs report coming. A single news candle can flip both signals in seconds and trap a trader on the wrong side.
So check the economic calendar before you lean on either read. Around a major release, step back and let the dust settle. Because the tools lag price, they lag news even further, and the gap can prove costly.
Related Concepts to Study Next
The two tools connect to a web of sibling ideas, and a few deserve your next reading hour. Start with our full guide to the MACD for a deeper look at its lines and histogram. Then compare a second momentum pairing in our RSI vs Stochastic guide to see how the RSI stacks against a range tool.
Two more guides sharpen the picture. Because momentum shifts often show up first as divergence, read our notes on divergence in trading to spot the gap on either tool. Then tune your momentum read for a faster pace with our guide to RSI settings for day trading.
For hands-free charting, the MACD indicators archive plots the lines and histogram for you, while the RSI indicators archive gathers the momentum tools around it. Tools speed the work, yet the logic above still carries the trade. So learn the rules first, and let any indicator plot what you already understand.
FAQ
Is the MACD or the RSI better?
Neither is better in the abstract. The MACD reads trend and momentum together, while the RSI flags stretched conditions on a fixed scale. Match the tool to the market and use them together for a fuller read.
Can I use the MACD and RSI at the same time?
Yes, and many traders do. Let the MACD lead on trend direction and its shifts, then let the RSI guard the entry against a stretched move. When both agree, the signal carries more weight.
What are the standard settings for each tool?
The MACD defaults to 12, 26, and 9, and the RSI defaults to 14 with 70 and 30 bounds. Those numbers suit most swing and intraday work. Test any change across many charts before you rely on it.
Which tool is better for spotting reversals?
The RSI often flags a stretched move earlier, while the MACD confirms the actual shift through its cross. So many traders use the RSI as the early warning and the MACD as the confirmation.
Why do the MACD and RSI sometimes disagree?
They measure different things. The MACD reads the gap between two moving averages, while the RSI reads the balance of recent gains and losses. So the same move can leave one climbing while the other stalls.
Do these tools work in every market?
They work best in trending or gently moving markets and struggle in tight ranges. In flat chop, the MACD whipsaws and the RSI drifts near 50. Manage risk on every trade. Results are not guaranteed; past performance is not indicative of future results.
External references
- For background on this concept, see Gerald Appel on Wikipedia.
- For broader market context, see Relative Strength Index (RSI) at Corporate Finance Institute.

About the author
Written by Dominic Walsh, a Forex trader and MT4/MT5 indicator, Expert Advisor and script developer. Every tool on forexmt4systems.com is tested on live charts before release and ships with ready-to-use compiled MT4 (.ex4) and MT5 (.ex5) files. Learn more about the trader and developer behind this site.
How we build, test and correct every tool: Editorial & Testing Policy. Trading carries risk; see the disclaimer.