
Learning how to use CCI indicator signals gives you a clean read on momentum and when a market has stretched too far from its own average. The Commodity Channel Index measures how far price sits from a moving mean, so it flags fresh strength, fading exhaustion, and the quiet turns in between.
This guide shows how to use CCI indicator signals on real forex charts. By the end you will trade the plus and minus 100 breakouts, read the zero-line for trend bias, and spot the divergences that warn a move is running out of fuel.
How to Use CCI Indicator Signals in Forex
Donald Lambert built the Commodity Channel Index in 1980. He designed it to spot cyclical turns in commodities, yet forex traders adopted it fast. It is an unbounded oscillator, so it can travel well beyond its usual range in a strong move.
The standard setting is a 20-period CCI. The formula compares the typical price of each bar against a 20-period average of that price, then scales the gap by the average deviation. So a reading near zero means price hugs its mean, and a reading far above or below means price has pulled away sharply.
Look at a concrete case. The chart shows GBPUSD on the one-hour timeframe near 1.3400, with a 20-period CCI in a lower pane. Price coils near its average while the CCI hovers around zero, then a strong bullish push drives the CCI above the plus 100 line. That single frame holds the calm, the breakout, and the momentum surge in one view.
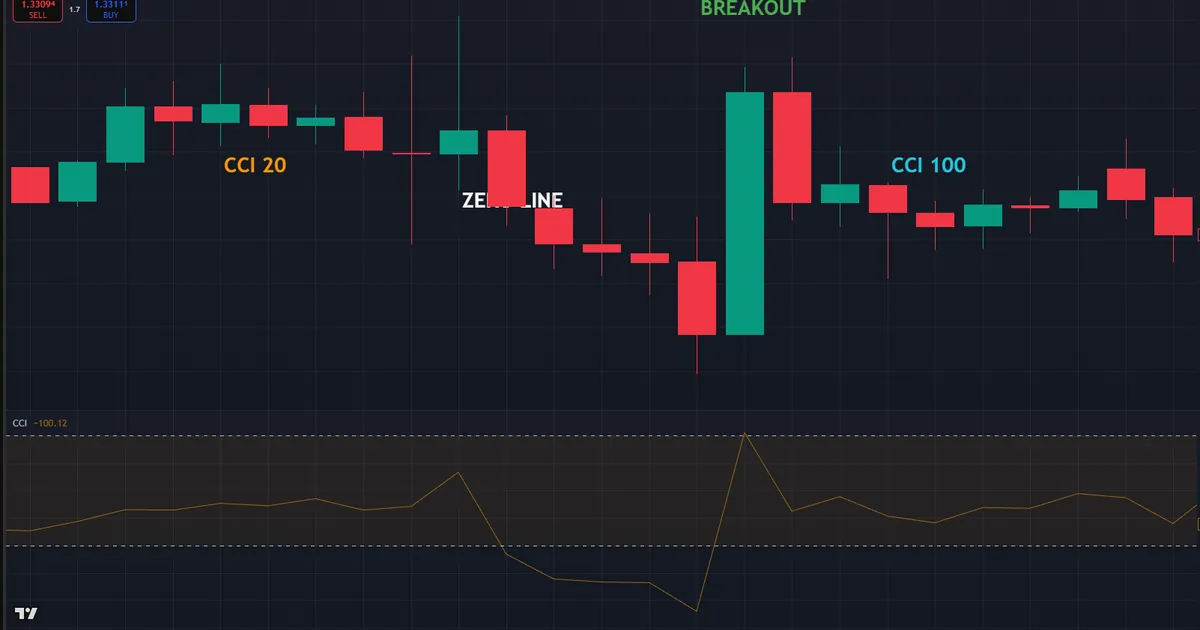
Now trace the logic from left to right. First the CCI drifts around zero while the range is quiet. Then a wide candle pushes it above plus 100, signalling that price has broken out of its normal band. Because the move cleared that threshold, momentum has genuinely shifted rather than merely wobbled. So the CCI framed the exact moment the pressure changed.
Why does this matter for real trades? The CCI gives you context, not a blind buy or sell. So a cross above plus 100 means strength in a trend and possible exhaustion in a range. Read the backdrop first, and the same cross stops sending mixed messages.
What the Commodity Channel Index Measures
The math looks busy, yet the idea is simple. Learn it once and the readings make sense forever. Four parts drive everything you see on the chart.
- Typical price. Add the high, low, and close of each bar, then divide by three for a fair midpoint.
- Moving average. Take a 20-period average of that typical price as the fair-value anchor.
- Mean deviation. Measure how far, on average, the typical price wanders from that mean.
- The scaling constant. Multiply the deviation by 0.015 so that most readings land between plus and minus 100.
- Final CCI. Divide the gap by that scaled deviation to get the oscillator value you read.
So the CCI is really a distance meter. It reports how far price has strayed from its recent average, measured in units of typical volatility. The concept graphic below shows that distance turning into a single oscillator line.

Because Lambert chose the 0.015 constant deliberately, roughly seventy to eighty percent of readings fall inside the plus and minus 100 band. So a move beyond that band marks a genuine stretch, not routine noise. That design is why the plus and minus 100 lines carry real meaning rather than arbitrary weight.
The unbounded nature matters too. Unlike a stochastic that caps at 100, the CCI can climb to 200, 300, or higher in a powerful trend. So an extreme reading is not a ceiling. Instead it confirms how far price has pulled from its mean, which is why a high value alone never justifies a fade.
Why Twenty Periods
The default 20 is not magic, yet it earns its place. Twenty bars smooth the jitter of any single candle while still tracking the current cycle. So the line stays responsive without twitching on every tick.
Still, you can flex it with a reason. A shorter 14-period CCI reacts faster and suits scalping on lower timeframes. A longer 40-period CCI calms the line for swing reads on the daily chart. Change one setting at a time, then judge the effect before you touch it again.
Reading the Zero-Line
The zero-line splits the oscillator into two moods. Above zero, the typical price sits over its average, so buyers hold the near-term edge. Below zero, sellers hold it instead.
Because the zero cross marks a shift in that balance, many traders use it as a simple bias filter. So they favour longs while the CCI holds above zero and shorts while it stays below. That single rule keeps you trading with the near-term drift rather than against it.
Three Ways to Trade the CCI
The CCI earns its keep in three clear jobs. Each suits a different market state, so match the signal to the backdrop in front of you. Read the trend first, and the right method picks itself.
The Plus and Minus 100 Breakouts
A cross above plus 100 says momentum has broken out of its normal band. In a trending market, that break often marks the start of a fresh leg rather than an ending. So a move above plus 100 can be a signal to join strength, not to fade it.
The mirror applies below. A cross under minus 100 flags strong downside momentum, which can open a short in a falling market. Because the CCI is unbounded, it can ride far past 100 during a powerful trend. So do not short simply because the reading looks high, since a strong move can stay stretched for a long time.
Overbought and Oversold Fades
Inside a range, the plus and minus 100 lines flip their meaning. Price stretches above plus 100, runs out of buyers, and drifts back toward zero. So a tag beyond the band inside a range becomes a fade back to the mean.
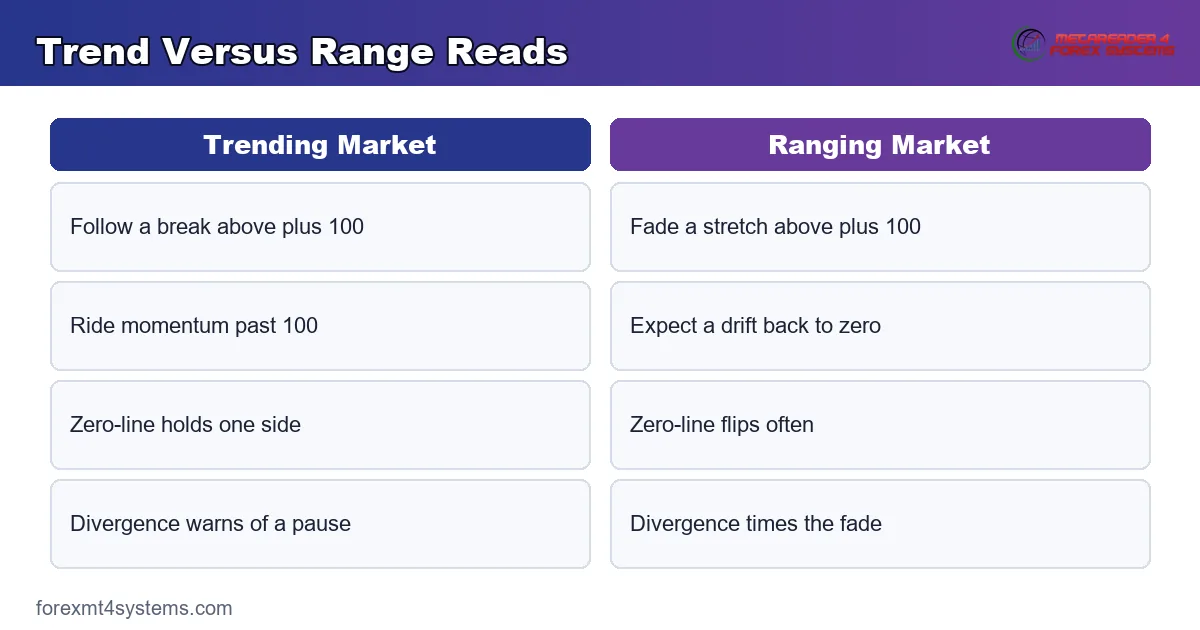
The rule reduces to one question. Is the market trending or ranging right now? In a trend, treat a break beyond 100 as momentum to follow. Inside a range, treat it as a stretch to fade. Read that context first, and the CCI stops contradicting itself.
Divergence Signals
Divergence is the CCI’s early-warning tool. It appears when price and the oscillator disagree about a move. So a fresh price high paired with a lower CCI high hints that momentum is fading beneath the surface.
The bullish version mirrors it. Price prints a lower low while the CCI carves a higher low, which suggests selling pressure is drying up. Because divergence warns of exhaustion before price turns, it belongs in your read as a caution flag rather than an instant entry. Wait for price to confirm before you act on it.
Settings, Timeframes, and Pairing
The default 20-period CCI suits most forex charts, and I would start there before changing anything. The timeframe you read it on shapes the signal more than the length. So match the CCI chart to the chart you actually trade.
For an intraday trader on the five-minute and fifteen-minute charts, a faster 14-period CCI can sharpen the read. For a swing trader on the four-hour and daily charts, the standard 20 or a slower 40 smooths the noise. Because each frame carries its own rhythm, pick one and let the settings match it.
Pairing the CCI With Structure
The CCI reads best beside support and resistance. A break above plus 100 that fires right at a broken resistance level carries far more weight than one in open space. So let structure grade the quality of every CCI signal.
Because momentum and location reinforce each other, the cleanest trades stack both. A divergence at a major swing high beats a divergence in the middle of a range every time. So map the key levels first, then let the CCI time your entry around them.
Confirming With a Second Read
One oscillator alone leaves gaps, so a second read helps. A trend filter, such as a moving average slope, tells you whether to follow a breakout or fade it. So the filter answers the trend question while the CCI answers the timing question.
Keeping notes sharpens the process further. Because patterns repeat, a written record of which CCI setups worked in which conditions builds real edge over time. Our free trade journal gives you a simple place to log each signal and review it later.
Worked Example: A CCI Breakout on GBPUSD
Picture GBPUSD grinding sideways through a quiet European morning near 1.3380 on the one-hour chart. The 20-period CCI hovers just under zero, and price coils below a clear resistance shelf. The whole range feels undecided.
Then the setup resolves. A firm bullish candle closes above resistance near 1.3405, and the CCI pushes decisively above plus 100. That break aligns momentum with a level, which is exactly the pairing worth taking. The chart below marks the breakout candle, the resistance shelf, and the CCI crossing plus 100.
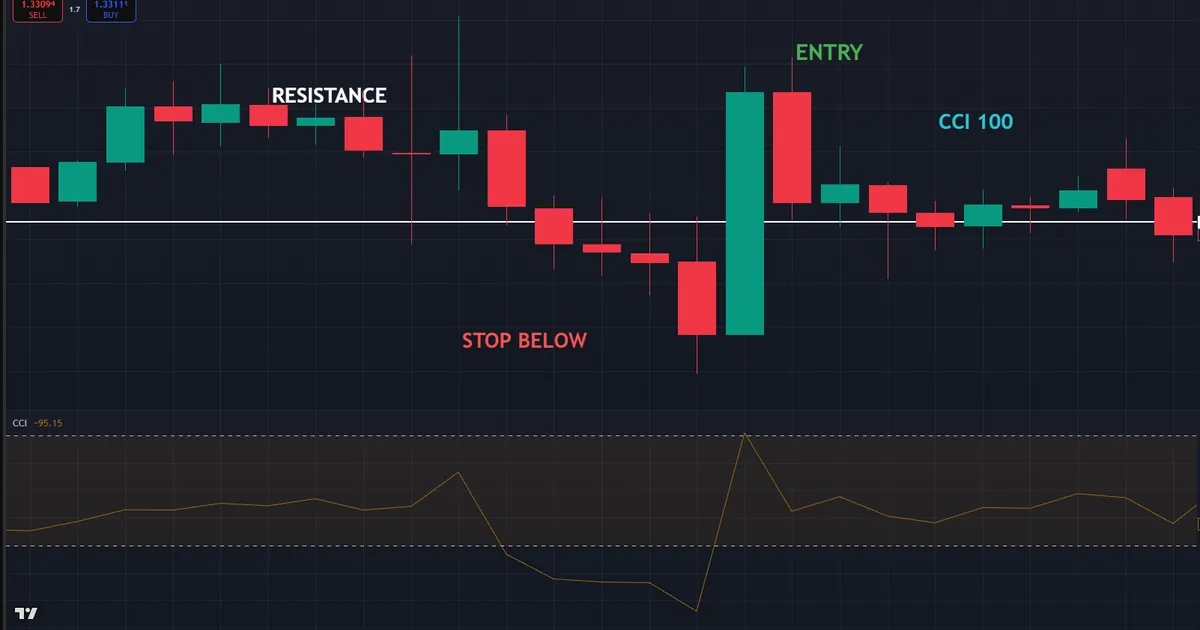
Now the trade builds itself. A long on the close of the breakout carries a stop below the resistance-turned-support shelf, roughly 30 pips of risk near 1.3375. Because the CCI confirmed the push, the entry rests on momentum and location together. So the first target sits at the next swing high, with the stop protecting the level behind price.
The follow-through rewarded the read. Price extended off the shelf, the CCI held above zero through the run, and the move reached the target within the London session. So momentum and structure carried the trade from start to finish. That alignment is what a clean CCI signal looks like in practice.
Compare that with a naked breakout. Without the CCI, the same candle above resistance offers no read on the force behind it. Because the oscillator confirmed real momentum, the trader could size with confidence instead of hope. So the CCI did not create the level, yet it graded the break that mattered.
Why the Signal Held
Notice how each piece supported the next. First the resistance level set the location. Then the CCI break above plus 100 timed the entry. Finally the zero-line hold confirmed the trend stayed healthy. Because the tool framed every stage, the trader never had to guess where the idea began or ended.
Download the complete indicator database
Put these concepts on your charts. One email unlocks the full library of 1,380+ indicators with compiled MT4 and MT5 files, plus my TradingView scripts. No paywall, no spam, unsubscribe any time.
Get free access to my indicator database
One email unlocks 1,380+ free MT4, MT5 and TradingView indicators — the complete library. No single-tool download; you get the whole database.
Common CCI Mistakes and How to Fix Them
The tool is simple, yet the same errors repeat on every timeframe. Most trace back to one decision, mapped in the graphic below: follow momentum in a trend, or fade it inside a range. So the fixes all flow from reading that context right.
Fading Every Reading Above 100
A reading above plus 100 is not an automatic short. In a strong trend, the CCI can ride far beyond 100 for many bars. So confirm the market is ranging before you fade a high reading, and read the trend before you trust one.
Ignoring the Zero-Line Bias
Trading longs while the CCI sits deep below zero fights the near-term drift. The zero-line tells you which side holds the edge. So favour signals that agree with the current side of zero, and treat counter-trend signals as lower-grade setups.
Acting on Divergence Too Early
Divergence warns of fading momentum, yet it is not a turn on its own. Price can keep running while the oscillator lags for a long stretch. So wait for price to confirm with a broken level or a reversal candle before you act on any divergence.
Using the CCI Alone
The CCI measures momentum, not structure or volatility. Leaning on it with no other read leaves half the picture blank. So pair it with support, resistance, and a trend filter, and the weak signals filter themselves out.
Chasing a Late Breakout
A CCI break that fires after price has already run far offers a poor entry. The reward has mostly left the move by then. So take the break near a fresh level, not deep into an extended leg where the stop must stretch to survive.
Forcing Trades in Chop
In a flat, newsless market, the CCI whipsaws across the bands all session. Every breakout reverses, and every fade gets run over. So when the higher timeframe shows a lifeless box, stand down and wait for a cleaner backdrop.
Pre-Trade CCI Checklist
Run this short list before every entry. A few seconds here saves hours of regret later. So keep it beside the chart and let it slow your hand whenever a tempting CCI cross appears out of nowhere.
- Trend or range identified on the higher timeframe.
- Zero-line bias checked before choosing a direction.
- A break beyond plus or minus 100 aligned with that bias.
- A key support or resistance level near the signal.
- Divergence, if present, confirmed by price before acting.
- Stop placed beyond the level, with size set from it.
- Entry, stop, and target defined before the trade goes live.
When the CCI Fails
Study the failure case as hard as the winner. Here is a common one. EURUSD prints a tight range near 1.1420 on the fifteen-minute chart, then the CCI pops above plus 100 on a single wide candle. Every box looks ticked for a long.
Then the breakout dies. Price fails to extend, snaps back inside the range, and the CCI collapses under zero within a few bars. The chart below shows that false break, with the reclaimed range marked.

So what went wrong? Usually the context. In this case the higher timeframe was ranging, not trending, so the CCI pop fired inside a larger box. The market treated the surge as another swing to fade. Hence the invalidation rule that limits the damage: once price closes back inside the range and the CCI drops under zero, the breakout idea is dead. Exit at once, without widening the stop.
Whipsaws in Sideways Markets
A flat market drags the CCI back and forth across the bands. Each cross looks like a signal, yet none follows through. So in a confirmed range, treat plus and minus 100 as fade zones, not breakout triggers, and demand a level to back the trade.
News Spikes Distort the Reading
A sudden headline can fling the CCI far past 100 in one candle. That spike says nothing about a tradable trend. So a CCI reading right after high-impact news often misleads. Let the dust settle for a few candles before you trust any signal near a release.
Sizing Keeps a Bad Read Small
Even a clean-looking CCI break can fail, so plan for it. Because a false break usually reverses fast, a stop beyond the level caps the damage. Our free position size calculator turns that stop distance into a lot size that keeps each loss controlled. So a failed signal stays a scratch rather than a wound.
Related Concepts to Study Next
The CCI connects to a web of sibling oscillators, and a couple deserve your next reading hour. The tool has a full introduction of its own, so our guide to the CCI indicator covers the basics in more depth. Then a natural comparison waits next door, and our guide to the stochastic oscillator shows a different way to read the same momentum.
Combining oscillators lifts your read further. Because each tool frames momentum a little differently, our walk-through of the stochastic oscillator in practice pairs well with the breakout logic here. So the CCI flags the stretch while a second oscillator confirms the turn.
For hands-free charting, the oscillator indicators archive plots CCI-style tools automatically, while the momentum indicators archive covers the confirmation reads around them. Tools speed the work, yet the logic above still carries the trade.
FAQ
What are the best CCI settings for forex?
The standard 20-period CCI suits most forex charts and timeframes. Shorten it to 14 for faster intraday reads, or lengthen it to 40 for calmer swing signals on the daily. Change one setting at a time so you can judge the effect before adjusting again.
What do plus and minus 100 mean on the CCI?
They mark the edges of the oscillator’s normal band, chosen so most readings fall inside them. A move above plus 100 flags strong upside momentum, and a move below minus 100 flags strong downside. Whether you follow or fade the break depends on whether the market is trending or ranging. Because the CCI is unbounded, it can push well past those lines, so treat them as thresholds rather than hard ceilings.
How do I read the CCI zero-line?
The zero-line splits buyers from sellers. Above zero, the typical price sits over its average, so buyers hold the near-term edge. Below zero, sellers do. Many traders use the current side of zero as a simple bias filter for their trades. So they favour longs while the reading holds above zero and shorts while it stays below, which keeps entries aligned with the near-term drift.
Does CCI work for day trading?
It does, especially the breakout and fade methods on lower timeframes. A faster 14-period setting suits the five-minute and fifteen-minute charts, and pairing the CCI with support and resistance filters weak signals. Favour the London and New York sessions for the cleanest moves, since thin liquidity in the Asian hours tends to produce more false breaks across the bands.
What is CCI divergence?
Divergence appears when price and the CCI disagree about a move. A higher price high with a lower CCI high hints that momentum is fading, while a lower price low with a higher CCI low hints that selling is drying up. It warns of exhaustion, so wait for price to confirm before acting.
Is the CCI reliable on its own?
The CCI measures momentum, not structure or volatility, so it reads best beside other tools. Pair it with support, resistance, and a trend filter for cleaner signals, and let structure grade each break before you commit. Manage risk on every trade. Results are not guaranteed; past performance is not indicative of future results.
External references
- For background on this concept, see Commodity Channel Index (CCI) at Corporate Finance Institute.
- For broader market context, see Trading Trends With the CCI at Investopedia.

About the author
Written by Dominic Walsh, a Forex trader and MT4/MT5 indicator, Expert Advisor and script developer. Every tool on forexmt4systems.com is tested on live charts before release and ships with ready-to-use compiled MT4 (.ex4) and MT5 (.ex5) files. Learn more about the trader and developer behind this site.
How we build, test and correct every tool: Editorial & Testing Policy. Trading carries risk; see the disclaimer.