
So what is stochastic oscillator trading, and why does this pair of wiggling lines sit under so many forex charts? The stochastic oscillator measures where the current close sits inside the recent high-to-low range, then turns that position into two lines that swing between 0 and 100. After this guide you will read the %K and %D lines with confidence, mark the 80 and 20 levels, and turn a line crossover or a divergence into a plan you can act on.
Knowing what is stochastic oscillator behaviour also keeps you out of a classic trap. In a range it calls turns nicely, and in a strong trend it can scream overbought for hours while price climbs anyway. Read the context first, and the same two lines tell two very different stories.
What Is Stochastic Oscillator Math on the Chart
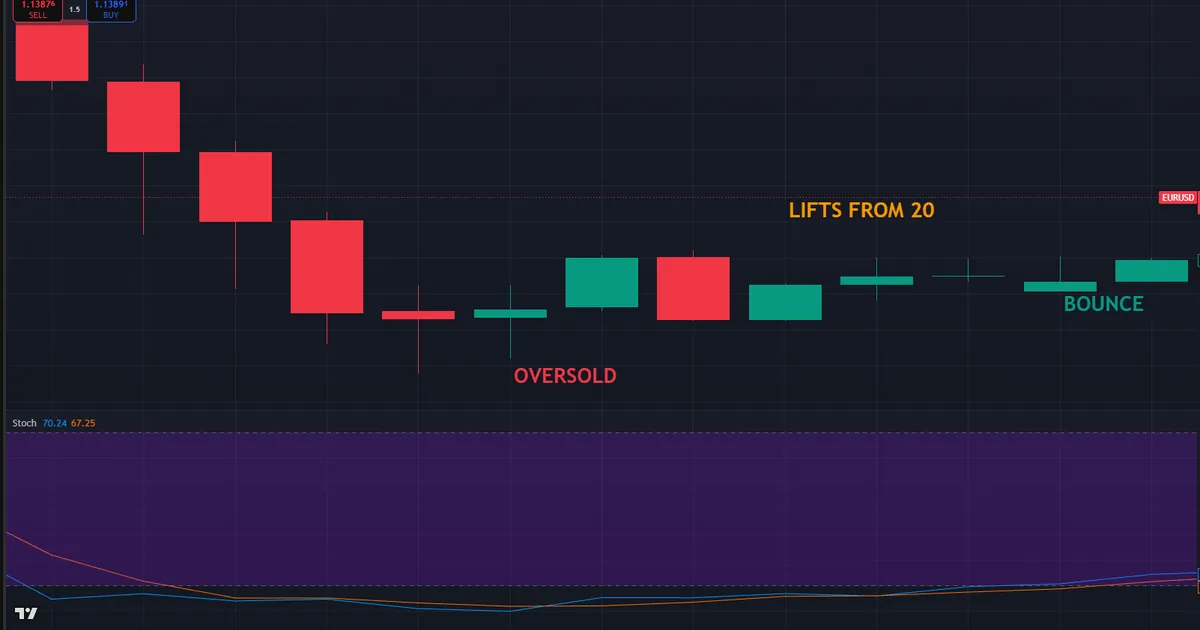
George Lane popularised the stochastic oscillator in the late 1950s, and its idea is refreshingly plain. When a market trends up, closes tend to cluster near the top of each bar’s range. When it falls, closes cluster near the bottom. So the tool simply asks where today’s close sits inside the recent range, and it reports that as a percentage. The chart below shows a EURUSD 1-hour reading with both lines lifting out of the 20 zone as a bounce begins.
Two Levels and Two Lines
Start with the map, because it never changes. Two horizontal levels frame the pane: 80 near the top and 20 near the bottom. A reading above 80 marks an overbought stretch, where closes have pressed near the top of the range. A reading below 20 marks the oversold mirror. Between them sit the two lines that do the talking, and learning which is which speeds up every read.
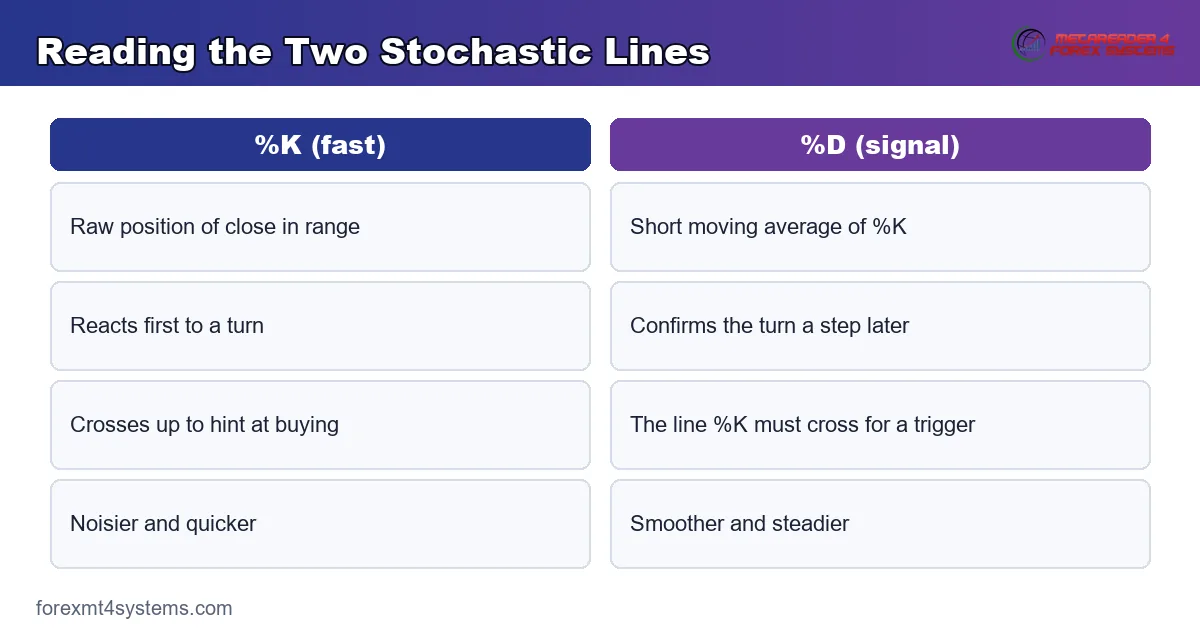
Now meet the lines themselves. The faster line is %K, the raw position of the close inside the range. Its slower partner is %D, a short moving average of %K that smooths the noise. So %K reacts first and %D confirms, and the space between them powers the crossover signals traders watch for.
Fast, Slow, and the 14, 3, 3 Default
You will meet two flavours of the tool, so it helps to tell them apart. The fast stochastic plots raw %K against its signal line and jumps around a lot. The slow stochastic smooths %K by an extra three periods before plotting, which cuts the whipsaw. Most platforms default to a 14, 3, 3 slow stochastic: a 14-bar range, a 3-period smoothing on %K, and a 3-period %D. That %K14 %D3 pairing is the setting behind most of the charts you will see, and it makes a sensible starting point.
How the Stochastic Oscillator Works
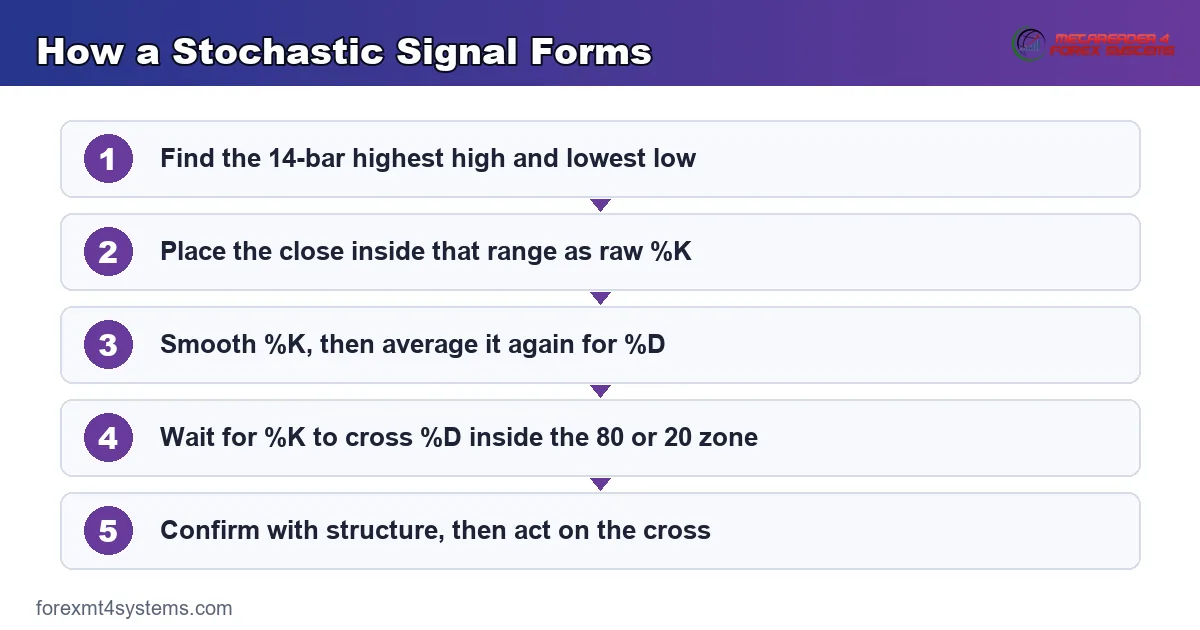
The calculation is short, and walking it once makes every later signal clearer. Each bar the tool locates the highest high and lowest low of the lookback window, then measures where the close sits between them. The steps below spell out a 14-period reading.
- First, find the highest high and the lowest low over the last 14 bars.
- Next, subtract that lowest low from the current close to get the distance travelled up from the floor.
- Then divide by the full range, the highest high minus the lowest low, and multiply by 100.
- Now you have raw %K, a value from 0 for the range low to 100 for the range high.
- Last, smooth %K with a short average to get the plotted %K, then average that again for the %D signal line.
The result reads like a thermometer for the range. A value of 100 means the close printed at the very top of the 14-bar window, while a value near 0 means it closed at the very bottom. Because the tool rescales to the recent range each bar, it adapts as volatility shifts. So a quiet market and a busy one both report on the same 0 to 100 scale, which keeps the 80 and 20 levels meaningful across time.
Why the Crossover Matters
Watch the moment %K crosses %D, because that is the core trigger. When the faster %K line rises through the slower %D line, momentum is turning up. When it falls through %D, momentum is turning down. Traders weight these crossovers far more heavily when they happen inside a zone. So a %K cross above %D down in the 20 area carries more meaning than a random cross in the middle of the pane, where the market has no clear lean.
Full Stochastic and Custom Smoothing
Some platforms offer a third flavour called the full stochastic, which hands you every dial. It lets you set the lookback, the %K smoothing, and the %D smoothing independently, so you can tune the tool to a pair’s personality. A jumpy pair might want more smoothing to calm the noise, while a slow pair might want less so signals arrive on time. Still, more freedom brings more ways to overfit. So start from the standard 14, 3, 3 and change one dial at a time, judging each tweak over weeks rather than a handful of trades.
The first graphic below breaks a stochastic signal into its plain-language flow, from range position to the crossover you trade.
Where the Stochastic Oscillator Fits Your Workflow
The stochastic is a timing tool, not a full system, so give it a defined role. Most traders keep the 14, 3, 3 default and only change it with a clear reason. A shorter lookback reacts faster and suits scalping, while a longer one smooths the swings for position work. Pick one setting, learn how it breathes on your pair, and resist the urge to retune it after every losing trade.
Matching Timeframe and Bias
Choose the timeframe to fit your plan before you read a single cross. Intraday traders often watch the stochastic on the 5-minute and 15-minute charts, while swing traders lean on the 1-hour and 4-hour. Then set a directional bias from price structure or a moving average. In an uptrend, favour oversold crosses that buy the dip, and ignore overbought readings that simply confirm strength. In a downtrend, do the reverse. The oscillator times the entry, and the trend picks the side.
Pairing the Stochastic With Structure
The stochastic shines when a second layer confirms it. Mark a support level, a swing point, or a trendline first, then wait for the oscillator to fire near that level. So a bullish cross out of oversold that lands right on prior support beats the same cross floating in empty space. That pairing filters out most of the weak signals the tool throws in choppy conditions, and it keeps you trading with structure rather than against it.
Timing Signals to the Session
Time can sharpen a stochastic read, so mind the clock. Momentum tools fire cleaner during active hours, when real volume drives the range, than during the thin, drifting Asian session. So many intraday traders watch for oversold and overbought crosses during the London morning and the New York open, when moves have follow-through. A cross that prints in a dead, low-volume hour deserves more caution, because a shallow range can flip the reading on the smallest wick. Anchor your best setups to the busier windows, and treat quiet-session signals as lower-confidence cues rather than green lights.
For a wider view of momentum tools, the oscillator indicators hub groups the stochastic with its cousins. If you focus on stretched readings specifically, the overbought and oversold indicators archive collects the tools that flag those zones.
Reading Crossovers, Zones, and Divergence
The stochastic gives three main reads, and mixing them up costs money. Keep them separate, and each earns its place. One reads the zones, one reads the crossover, and one reads the disagreement between price and the lines.
Zone and Crossover Reads
The zone read is the simplest. Above 80 the market looks overbought, and below 20 it looks oversold, though neither is a signal on its own. Add the crossover for a trigger. A %K cross above %D while both sit under 20 is a classic buy cue, and a %K cross below %D while both sit above 80 is the sell mirror. So the zone sets the context and the cross pulls the trigger, and the two together beat either read alone.
The Divergence Read
Divergence is the tool’s sharpest edge. When price prints a lower low but the stochastic prints a higher low, selling momentum is fading even as price drops, which can warn of a bounce. The mirror holds at highs. Pair that divergence with a structure break or a level, and it becomes a genuine reversal cue rather than a hopeful guess. Our guide to divergence in trading covers the pattern in full.
One habit sharpens every divergence read: mark the price swings first, then check the lines. Beginners often stare at the oscillator and imagine a divergence that the price action never confirms. So draw the two highs or two lows on price, note their direction, then compare the matching stochastic peaks or troughs. When price and the lines genuinely disagree, and a level sits nearby, the signal earns your attention. When they merely look messy, skip it and wait for a cleaner picture to form.
Worked Example: A Stochastic Bounce Buy on GBPUSD
Rules feel abstract until a real chart prices them, so walk through one. The chart below tracks a GBPUSD 1-hour sequence where the trend points up and the stochastic times a dip entry off a swing low.
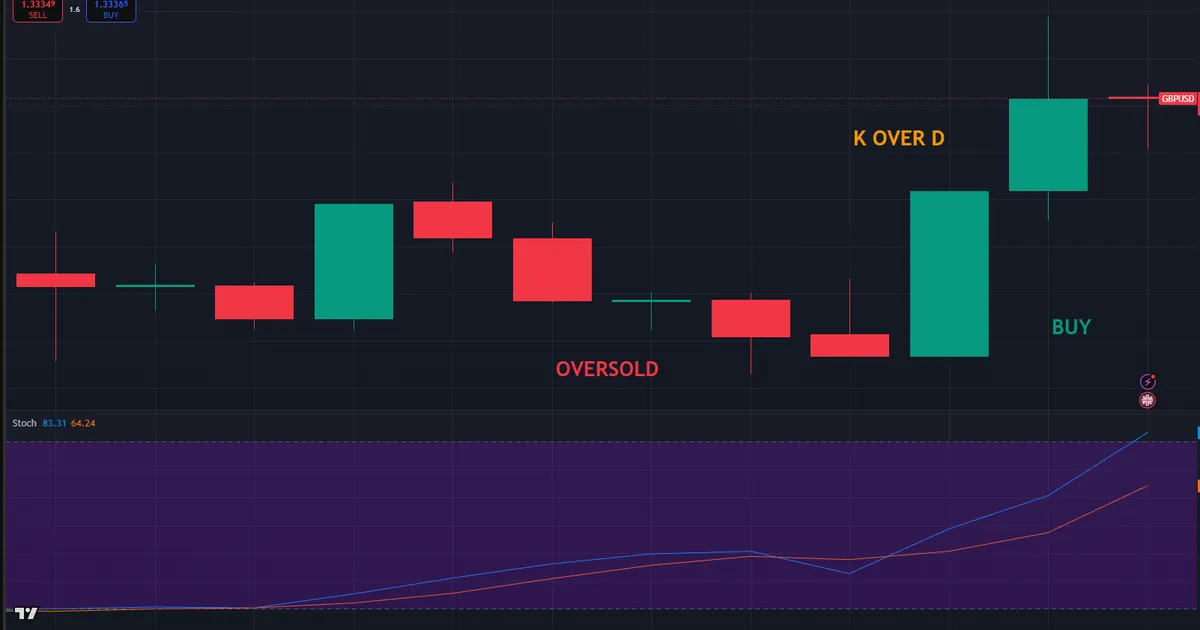
- First, the bias: price printed higher highs and higher lows, so the plan only hunted for longs.
- Next, the dip: a pullback dragged both lines down under the 20 level into oversold.
- Then the cross: %K turned up through %D while the pair held a prior swing low.
- The confirmation: the next candle closed strong, and both lines climbed back above 20.
- Last, the trade: buy the cross, stop below the swing low, and target the recent high.
The logic behind the entry matters more than the exact prices. A trending market breathes, and each pullback pushes the stochastic into oversold without ending the trend. So the cross out of the 20 zone signals that the pullback has run its course and buyers are stepping back in. The stop sits below structure, the target sits at the prior high, and the reward clears the risk with room to spare.
Managing the GBPUSD Trade
Manage the position with the same map that framed it. Many traders bank a partial as the stochastic reaches the 80 zone, slide the stop to breakeven, then let the rest run while the trend holds. Others exit fully on the first bearish cross above 80 and only hold runners when the higher timeframe backs the move. Choose one plan before entry and write it down. The oscillator hands you the timing, and your journal keeps you honest about following it.
Download the complete indicator database
Put these concepts on your charts. One email unlocks the full library of 1,380+ indicators with compiled MT4 and MT5 files, plus my TradingView scripts. No paywall, no spam, unsubscribe any time.
Get free access to my indicator database
One email unlocks 1,380+ free MT4, MT5 and TradingView indicators — the complete library. No single-tool download; you get the whole database.
Common Stochastic Oscillator Mistakes and Their Fixes
Stochastic errors sink more trades than entry errors, and a few dominate beginner journals. Most come from treating an overbought reading as an automatic sell. Each mistake below carries a plain fix you can apply on the very next chart.
- Selling every reading above 80 in an uptrend. Fix: in a strong trend the line can stay pinned high for hours, so wait for a bearish cross plus a structure signal.
- Trading crossovers in the middle of the pane. Fix: weight crosses that happen inside the 80 or 20 zones far more than crosses near 50.
- Ignoring the higher-timeframe trend. Fix: read direction first, then take only the crosses that agree with it.
- Retuning the settings after every loss. Fix: keep the 14, 3, 3 default long enough to learn how your pair behaves.
- Reading the stochastic on one timeframe alone. Fix: confirm the wider trend so a cross agrees with the larger picture.
- Treating an 80 or 20 touch as a signal. Fix: the zone is context, so wait for the crossover or a divergence to trigger.
The second graphic pairs the core reading rules with the traps, so a quick glance before you commit keeps the common errors fresh.
A Stochastic Oscillator Pre-Trade Checklist
Run these seven lines before any entry that leans on the stochastic. A single failure sends the setup back to the watchlist.
- The higher-timeframe trend is clear, and the planned trade agrees with it.
- Both lines have reached the 80 or 20 zone, not just a shallow wobble.
- A %K and %D crossover has fired inside that zone as the trigger.
- A support level, swing point, or trendline backs the signal.
- Any divergence between price and the lines has been noted and confirmed.
- The stop sits beyond the structure that would invalidate the idea.
- The target offers more than the risk, and the journal line is written first.
Also score a month of trades against this list. The line you skip most often is your real leak, and closing one leak beats collecting three new indicators.
When the Stochastic Oscillator Fails
The stochastic breaks down in strong trends, and Lane himself warned about it. In a powerful uptrend the lines can ride above 80 for a long stretch, a state traders call embedded. So anyone shorting each overbought reading gets stopped out again and again while price grinds higher. The tool is behaving correctly, flagging strong momentum, yet the fade read is simply wrong for a trend that refuses to pause.
Whipsaw is the other trap. In a flat, directionless market the lines dart across each other and poke both zones, firing cross after cross that leads nowhere. Hence a filter matters. Skip stochastic signals when price sits in a tight, messy range with no clean level nearby, and wait for a real trend or a defined range to return.
A Failure Walkthrough on EURUSD
One failure repeats more than the rest, and the chart below shows it. EURUSD sells off hard, and the stochastic drops under 20 into oversold. A bullish %K cross prints, so a trader buys the bounce, expecting the usual snap back. Yet the downtrend is too strong, price ignores the cross, and the slide continues.
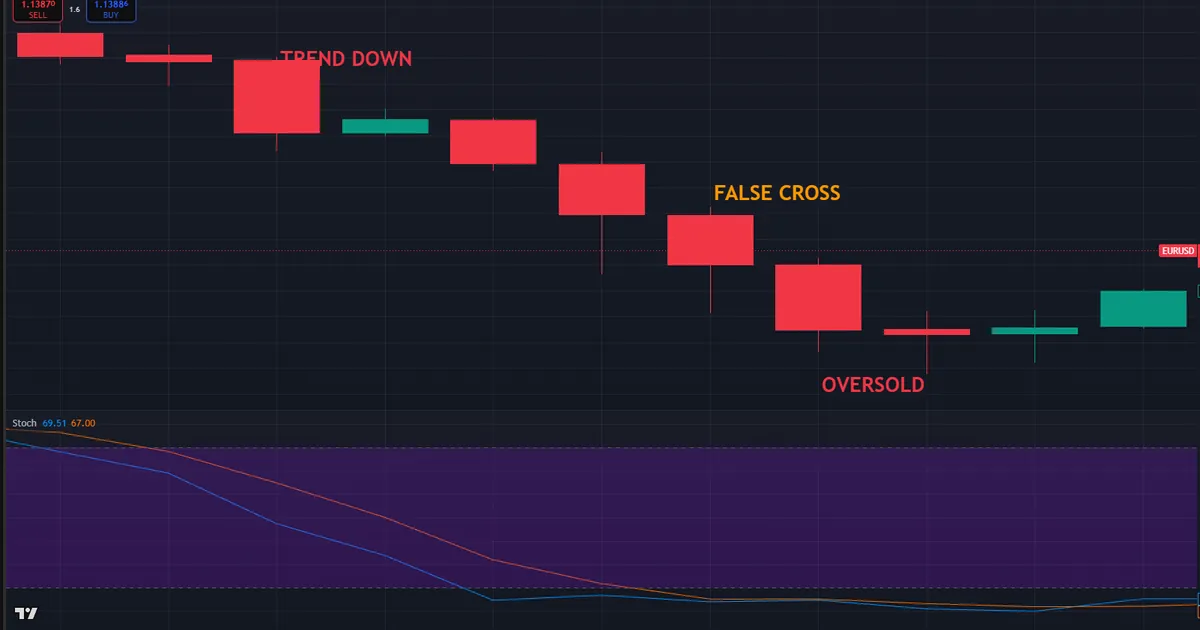
Resolution comes fast and teaches a clear lesson. The oversold cross fired inside a live downtrend with no support beneath it, so it fought the dominant flow. Thus the rule stays simple: in a strong trend, demand a higher-timeframe reason and a real level before you fade an extreme, and treat an embedded reading as proof of strength rather than a signal to reverse. That patience filters out most of these trend traps before they cost you. Log each failed cross, and the pattern soon jumps off the page.
Related Concepts to Study Next
The stochastic connects to several ideas worth learning together. The CCI indicator guide covers an unbounded momentum tool that reads extremes on a different scale, which makes a useful contrast with the bounded stochastic. Then the Williams %R guide explains a close cousin that inverts the same range calculation. For a faster momentum tweak on a related oscillator, the day-trading RSI settings guide shows how shorter lengths change behaviour.
Timing tools also work better when you size trades with a cool head. The position size calculator turns your stop distance into a lot size that fits your risk, so a tempting oversold cross never pushes you into an oversized trade. Read the oscillator for the entry, and let the calculator keep the risk honest. A good signal on an oversized position is still a bad trade, so size first and let the setup earn its place.
FAQ
What is the stochastic oscillator in simple terms?
The stochastic oscillator measures where the current close sits inside the recent high-to-low range, on a scale from 0 to 100. Closes near the top push the reading toward 100, and closes near the bottom drag it toward 0. Traders use the two lines, %K and %D, to spot overbought and oversold conditions and to time entries with a crossover.
What do 80 and 20 mean on the stochastic?
They mark the overbought and oversold zones. A reading above 80 shows closes pressing near the top of the recent range, and a reading below 20 shows closes pressing near the bottom. Neither is a signal by itself. Most traders wait for a crossover inside the zone, or a divergence, before acting on an extreme reading.
What is the difference between %K and %D?
%K is the faster line, the raw position of the close inside the range. %D is the slower signal line, a short moving average of %K. Because %K reacts first, the moment it crosses %D gives the core trigger. The %D line smooths the noise and confirms the turn, which is why the crossover between them carries the signal.
What is the best stochastic setting?
The common default is a 14, 3, 3 slow stochastic, and it suits most traders on most timeframes. A shorter lookback reacts faster for scalping, while a longer one smooths the swings for position trading. No single setting fits every market, so keep one configuration long enough to learn its rhythm before you change anything.
Does the stochastic work in a trending market?
It works best in ranges and struggles in strong trends. In a powerful move the lines can stay embedded above 80 or below 20 for a long time, so fading each extreme loses money. In a trend, use the stochastic only to time pullback entries in the trend’s direction, and lean on structure to keep you on the right side.
Can the stochastic be used for divergence?
Yes, and divergence is one of its stronger uses. When price makes a lower low but the stochastic makes a higher low, selling momentum is fading, which can warn of a bounce. The mirror holds at highs. Combine that divergence with a structure break or a level to confirm the turn before you act. Results are not guaranteed; past performance is not indicative of future results.
External references
- For background on this concept, see Stochastic at BabyPips Forexpedia.
- For broader market context, see Stochastic Oscillator at Corporate Finance Institute.

About the author
Written by Dominic Walsh, a Forex trader and MT4/MT5 indicator, Expert Advisor and script developer. Every tool on forexmt4systems.com is tested on live charts before release and ships with ready-to-use compiled MT4 (.ex4) and MT5 (.ex5) files. Learn more about the trader and developer behind this site.
How we build, test and correct every tool: Editorial & Testing Policy. Trading carries risk; see the disclaimer.