
So what is divergence in trading, and why do experienced traders treat it as an early warning rather than a signal to fire? Divergence is the disagreement between price and a momentum oscillator, where price pushes to a new extreme but the oscillator refuses to follow. After this guide you will spot regular and hidden divergence on the RSI, the MACD, and the stochastic, tell a reversal signal from a continuation signal, and confirm each one before you risk a cent.
Understanding what is divergence in trading also stops a common mistake in its tracks. A divergence warns that momentum is fading, yet momentum can fade for a long time before price actually turns. Read it as a heads-up that demands confirmation, and it becomes one of the most useful reads on the chart.
What Is Divergence in Trading on the Chart
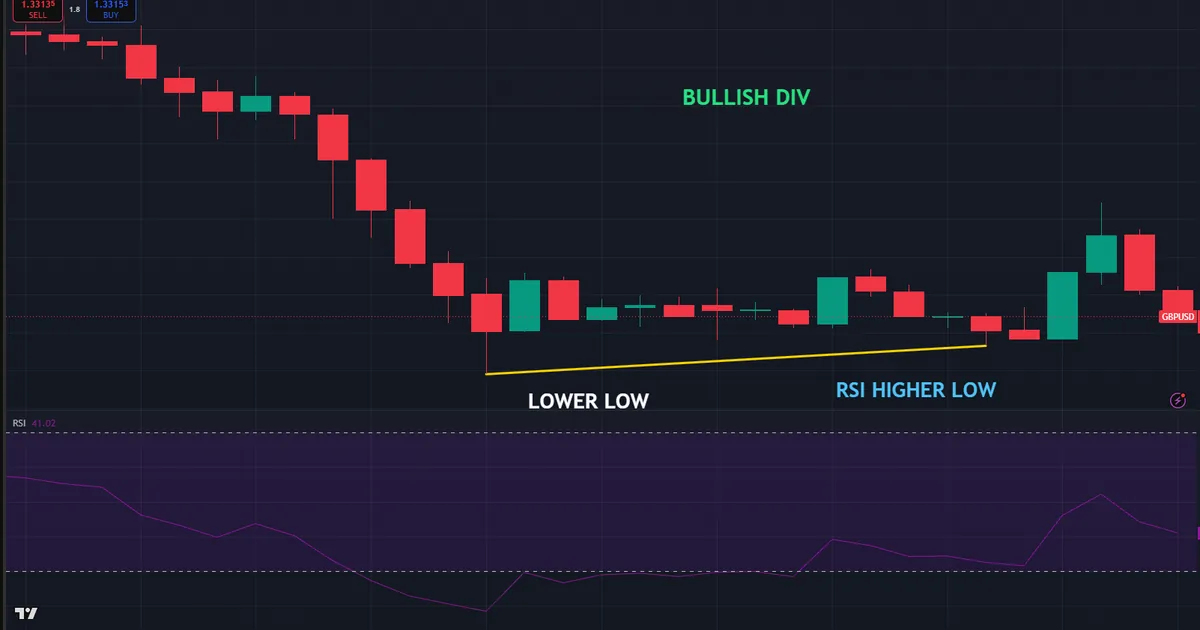
Divergence lives in the gap between two stories. Price tells one story with its highs and lows, and a momentum oscillator tells another with its own peaks and troughs. When those two stories agree, the trend is healthy. When they split, the move is running on fading fuel. The chart below shows a GBPUSD 1-hour example where price carves a double bottom while the RSI prints a higher low, the classic bullish divergence.
Price Versus the Oscillator
Start with the core comparison, because everything flows from it. You read two swings on price, then read the matching two swings on the oscillator below. If price makes a higher high but the oscillator makes a lower high, buyers are pushing price up with less force each time. So the new high is weaker than it looks, and momentum is quietly draining out of the move. That mismatch is the whole idea in a single picture, and once you see it clearly on one chart you will spot it everywhere.
Now flip it to the downside. If price makes a lower low but the oscillator makes a higher low, sellers are driving price down with less conviction. The fresh low lacks the momentum of the last one. Hence the market may be running out of sellers, which sets up the bounce that a bullish divergence hints at.
Which Oscillators Show It Best
Almost any momentum tool can reveal divergence, so pick one you trust and read it consistently. Most traders reach for the RSI first, since its smooth line makes peaks and troughs easy to compare. The MACD works well too, read either on its histogram or its lines. Stochastic and CCI show divergence just as clearly on their own scales. Whatever tool you choose, the reading method never changes: compare two price swings with the two matching swings on the oscillator.
How Divergence Works: Regular Versus Hidden
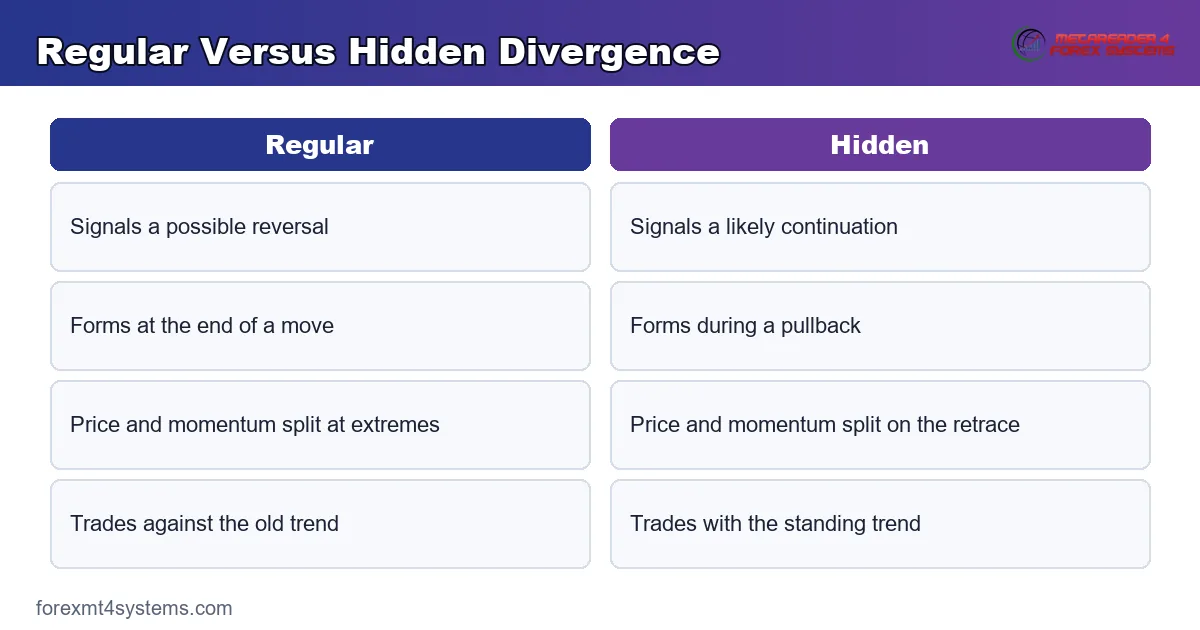
Divergence splits into two families, and mixing them up flips your read backward. Regular divergence warns of a reversal, while hidden divergence signals a continuation. Learning the four cases below takes a few minutes and saves a lot of confused trades.
- Bullish regular: price makes a lower low, the oscillator makes a higher low, and the market may turn up.
- Bearish regular: price makes a higher high, the oscillator makes a lower high, and the market may turn down.
- Bullish hidden: price makes a higher low, the oscillator makes a lower low, and an uptrend may resume.
- Bearish hidden: price makes a lower high, the oscillator makes a higher high, and a downtrend may resume.
Notice the neat symmetry. Regular divergence appears at the end of a move and points to a reversal. Hidden divergence appears during a pullback and points to a continuation in the trend’s direction. So the same tool either warns you a trend is ending or tells you a pullback is nearly done, depending on which pattern prints. Reading the trend context first tells you which one to expect.
Why Momentum Often Leads Price
Divergence works because momentum tends to peak before price does. Think about how a rally matures. Early on, buyers pile in fast and the oscillator spikes hard. Later, price can still edge to a new high, yet the buying arrives slower and with less force, so the oscillator makes a lower peak. That fading push is exactly what a bearish divergence captures. So the tool is not predicting the future by magic. It is simply measuring the speed of a move and flagging the moment that speed starts to drop, which often comes a little ahead of the turn in price itself.
The first graphic below sets regular and hidden divergence side by side, so the four cases stay straight in your mind.
Where Divergence Fits Your Workflow
Divergence is a context tool, not a standalone trigger, so give it a clear role. Read the trend first, then let divergence flag where momentum is shifting inside it. In an uptrend you hunt for bearish regular divergence at highs to warn of a top, or bullish hidden divergence at pullback lows to time a re-entry. Match the pattern to the trend, and the signal makes sense every time.
Reversal Trades With Regular Divergence
Regular divergence suits reversal hunters, but timing is everything. A bearish regular divergence at a major high says the uptrend is tiring, yet price can grind higher for many bars before it breaks. So wait for a confirmation, such as a break of a short-term swing low or a clear bearish candle, before you act. The divergence spots the fatigue, and the structure break confirms that sellers have finally taken control.
Continuation Trades With Hidden Divergence
Hidden divergence suits trend traders, and many find it the more reliable of the two. In an uptrend, a pullback that makes a higher low on price while the oscillator dips to a lower low often marks the end of that pullback. So you buy the resumption in the direction of the established trend, which keeps you trading with the flow rather than against it. Trading in the trend’s direction is usually kinder than fighting it at a reversal.
For the tools that show these patterns, the RSI indicators hub collects the momentum readings traders scan for divergence. The MACD indicators hub gathers the other favourite, whose histogram makes fading momentum easy to see.
Confirming a Divergence Before You Trade
A raw divergence is only half a setup, so never trade it alone. The market is full of divergences that fade into nothing, especially in strong trends. Confirmation is what separates a genuine turn from a false alarm, and it costs you only a little timing in exchange for far better odds.
Structure and Candle Confirmation
Wait for price to prove the divergence right. A break of the most recent swing point is the cleanest confirmation, since it shows control has changed hands. A strong reversal candle, such as an engulfing bar at the level, adds weight too. So the sequence reads divergence first, then a structure break or a decisive candle, then the entry. That patience filters out most of the divergences that never lead anywhere. The wait costs you a slightly worse entry price, since you are no longer buying the exact low or selling the exact high. Yet that small cost buys a large improvement in the odds, because you now trade a turn the market has confirmed rather than one you merely hope is coming.
Comparing Correlated Markets
One advanced read compares two correlated markets instead of price against an oscillator. This idea, drawn from the work of Michael Huddleston, the Inner Circle Trader (ICT), is called SMT divergence. When one pair makes a new high but a closely linked pair fails to, the disagreement hints that the move lacks broad support. Our SMT divergence guide covers that cross-market technique in full, and it pairs neatly with the oscillator reads in this article.
How to Judge a Divergence’s Quality
Not every divergence carries the same weight, so learn to grade them. Two divergences can look alike yet offer very different odds, and a quick quality check keeps you selective. Three factors do most of the sorting: location, clarity, and timeframe.
Location and Clarity
Location matters most, so start there. A divergence that forms at a major support or resistance level, or at a prior swing point, means far more than one floating in the middle of a range. Clarity comes next. You want two clean, obvious swings on price lined up against two clean swings on the oscillator, not a vague squiggle you have to squint at. So the best signals are unmistakable and land at a level that already matters. If you need to force the read, skip it and wait for a cleaner one.
Divergence Across Timeframes
Timeframe alignment lifts a signal from good to strong. A divergence on your trading timeframe carries more weight when the higher timeframe agrees with the direction it implies. So a bullish divergence on the 15-minute chart works better when the 1-hour trend is already turning up. Read the higher timeframe for the bias, then use the lower one to time the entry. When several timeframes point the same way, the divergence has real backing, and a lone signal against the bigger trend deserves far more caution.
Worked Example: A Bullish Divergence Long on GBPUSD
Rules feel abstract until a real chart prices them, so walk through one. The chart below tracks a GBPUSD 1-hour sequence where a bullish regular divergence sets up a long off a swing low.
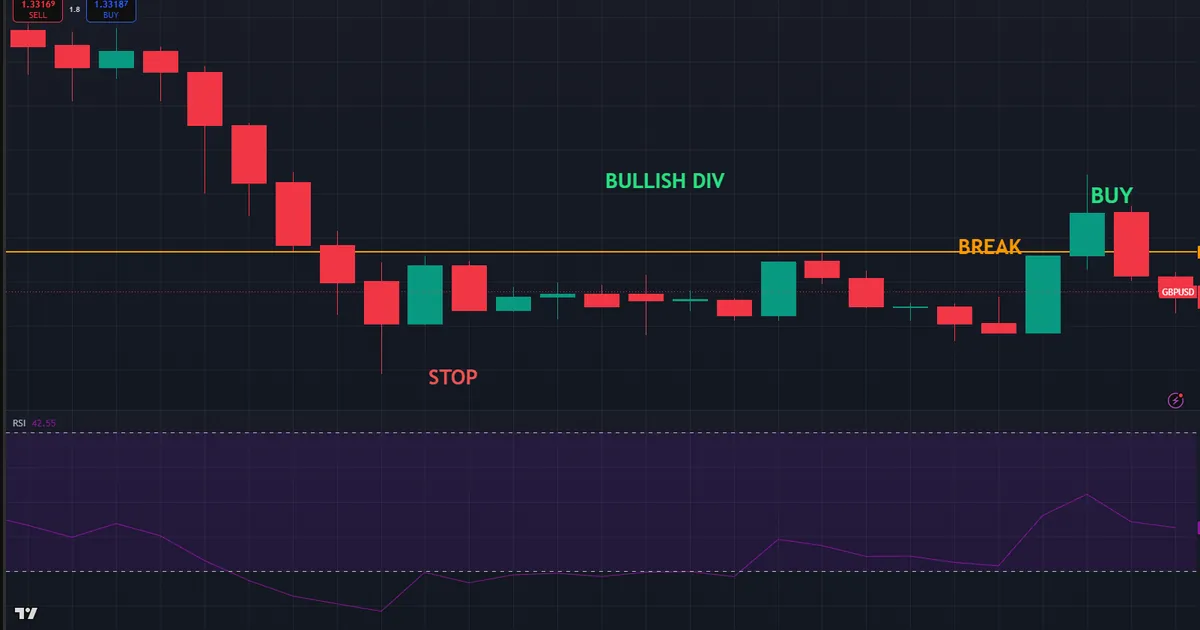
- First, the drop: price sold off and made a fresh lower low into the pull-back zone.
- Next, the tell: the RSI printed a clearly higher low, so downside momentum was fading.
- Then the wait: the divergence alone was not enough, so the plan watched for confirmation.
- The confirmation: price broke back above the last minor swing high, signalling the turn.
- Last, the trade: buy the break, stop below the divergence low, and target the prior swing high.
Here the logic behind the entry matters more than the exact prices. A lower low with a higher RSI low showed sellers running out of force, and the break of structure proved buyers had stepped in. So the divergence spotted the fatigue early, and the confirmation timed a safe entry after the turn began. The stop sat below the low that would have invalidated the read, which kept the risk defined and small.
Managing the GBPUSD Trade
Manage the position with the same logic that framed it. Many traders bank a partial at the first prior swing high, slide the stop to breakeven, then let the rest run toward a larger level. Others exit fully at the first strong resistance and only hold runners when the higher timeframe agrees. Choose one plan before entry and write it down. The divergence gave you the early warning, and your journal keeps you honest about waiting for confirmation every single time. Over enough trades, that discipline is what turns a promising pattern into a dependable part of your process rather than a source of impulsive entries.
Download the complete indicator database
Put these concepts on your charts. One email unlocks the full library of 1,380+ indicators with compiled MT4 and MT5 files, plus my TradingView scripts. No paywall, no spam, unsubscribe any time.
Get free access to my indicator database
One email unlocks 1,380+ free MT4, MT5 and TradingView indicators — the complete library. No single-tool download; you get the whole database.
Common Divergence Mistakes and Their Fixes
Divergence errors sink more trades than entry errors, and a few dominate beginner journals. Most come from trading the divergence the moment it appears, before price confirms anything. Each mistake below carries a plain fix you can apply on the very next chart.
- Trading a divergence with no confirmation. Fix: wait for a structure break or a strong reversal candle before you enter.
- Fading a powerful trend on one divergence. Fix: strong trends print several divergences before turning, so demand extra proof.
- Confusing regular and hidden divergence. Fix: read the trend first, then match the pattern to a reversal or a continuation.
- Imagining divergence the price never confirms. Fix: mark the two price swings first, then check the matching oscillator swings.
- Ignoring the higher timeframe. Fix: a divergence that agrees with the larger trend carries far more weight than one against it.
- Setting no invalidation level. Fix: place the stop beyond the extreme that formed the divergence, and honour it.
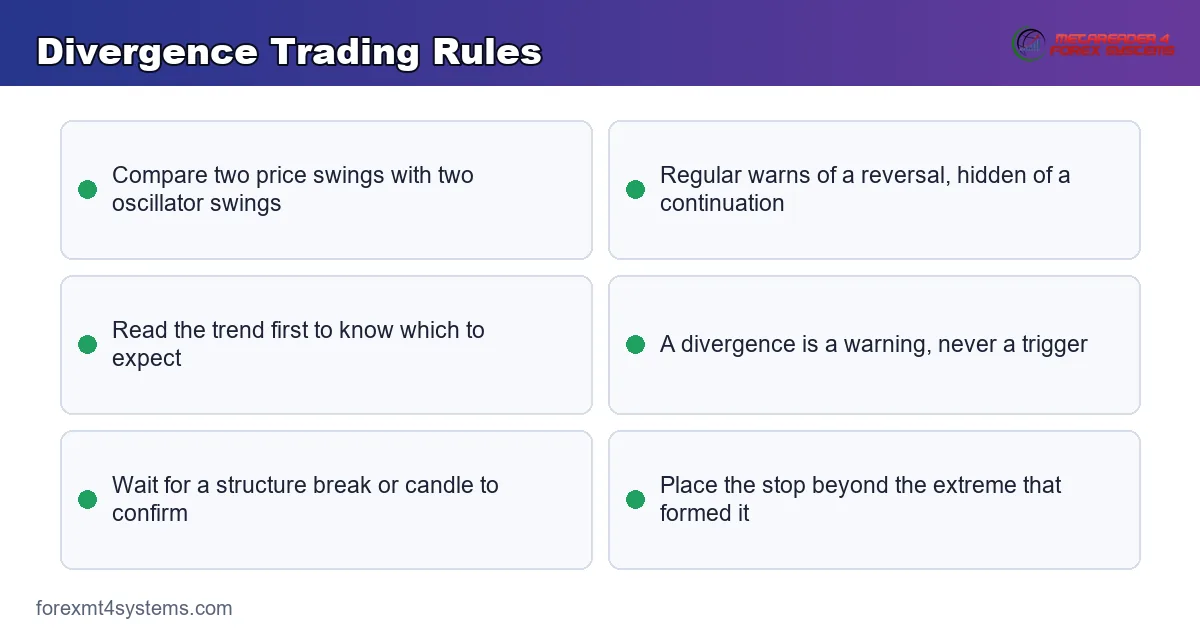
The second graphic pairs the core reading rules with the traps, so a quick glance before you commit keeps the common errors fresh.
A Divergence Pre-Trade Checklist
Run these seven lines before any entry that leans on a divergence. A single failure sends the setup back to the watchlist.
- The higher-timeframe trend is clear, and the divergence type fits it.
- Two clean price swings line up against two clear oscillator swings.
- The pattern is correctly read as regular for a reversal or hidden for a continuation.
- A structure break or a decisive candle has confirmed the turn or resumption.
- A level, such as support or resistance, backs the signal.
- The stop sits beyond the extreme that formed the divergence.
- The target offers more than the risk, and the journal line is written first.
Also score a month of trades against this list. The line you skip most often is your real leak, and closing one leak beats collecting three new indicators.
When Divergence Fails
Divergence breaks down in strong, trending markets, and honesty about that saves accounts. A powerful trend can print divergence after divergence while price marches on regardless. So a trader who shorts each bearish divergence in a raging uptrend gets stopped out over and over. Momentum is fading in a relative sense, yet the trend still has enough force to keep grinding higher for a long time.
The persistence trap catches many beginners. A divergence that fails often simply resets, forming a new one a little later that also fails. Hence confirmation is not optional. Skip a divergence until price actually breaks structure, and treat a string of failed divergences in one direction as a sign of real strength rather than a reason to keep fading.
A Failure Walkthrough on EURUSD
One failure repeats more than the rest, and the chart below shows it. EURUSD trends up hard, and the RSI prints a bearish divergence at a new high. A trader shorts the divergence, expecting the top. Yet price never breaks structure, pushes to another high, and the short stops out.
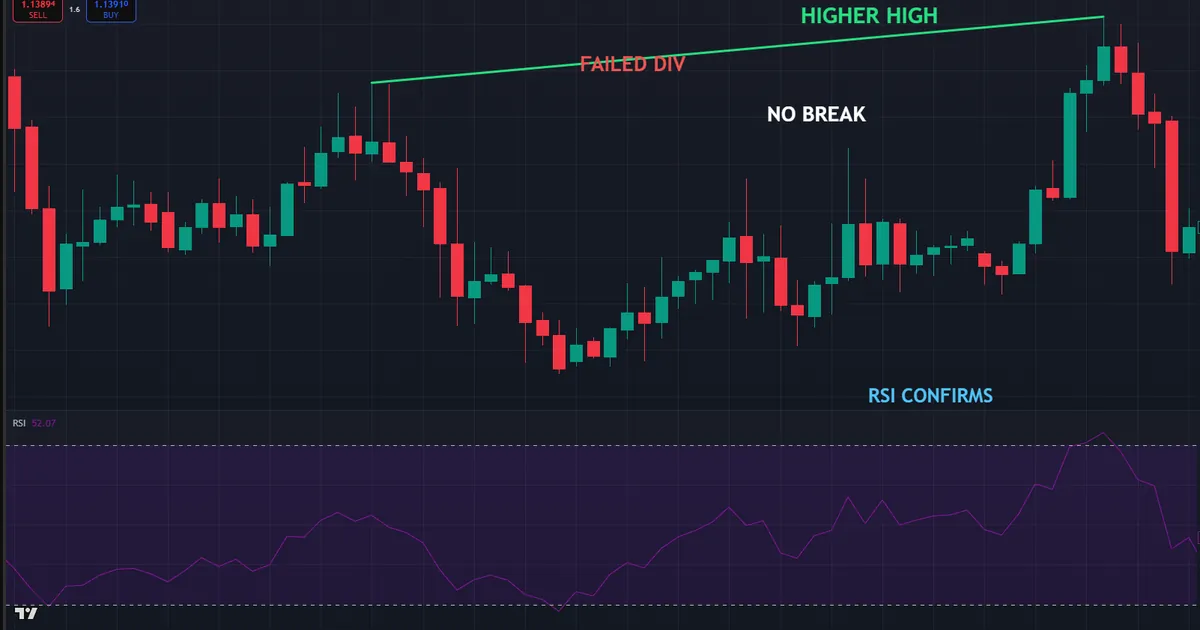
Resolution comes fast and teaches a clear lesson. The divergence flagged fading momentum, but no structure break ever confirmed a reversal, so the trade fought a live uptrend. Thus the rule stays simple: a divergence is a warning, never a trigger, and only a confirmed break of structure turns that warning into a trade. That single filter removes most of these trend traps. Log each failed divergence, and the pattern of missing confirmation soon jumps off the page, trade after trade, until waiting for the break becomes second nature.
Related Concepts to Study Next
Divergence connects to several ideas worth learning together. The stochastic oscillator guide shows a momentum tool whose two lines make divergence easy to compare. Then the CCI indicator guide covers an unbounded oscillator that flags divergence on its own scale. For a faster momentum setup that pairs well with divergence reads, the day-trading RSI settings guide shows how shorter lengths sharpen the signal.
Divergence trading also rewards careful record-keeping, because confirmation is a habit you build over time. The trade journal lets you log every divergence, note whether you waited for the break, and review which reads actually paid. Read the pattern for the warning, and let the journal turn each trade into a lesson you can measure. After a few dozen entries, a clear pattern usually appears: the confirmed divergences carried their weight, while the impulsive ones drained the account. That record is the fastest way to trust the process and to drop the setups that never earned their place.
FAQ
What is divergence in trading in simple terms?
Divergence is a disagreement between price and a momentum oscillator such as the RSI or MACD. Price pushes to a new high or low, but the oscillator fails to follow, which shows the move is losing momentum. Traders read it as an early warning that a trend may be tiring or that a pullback is nearly finished.
What is the difference between regular and hidden divergence?
Regular divergence signals a possible reversal and appears at the end of a move. Hidden divergence signals a likely continuation and appears during a pullback within a trend. The price and oscillator swings point in opposite directions for each type, so reading the trend context first tells you which pattern to expect and how to trade it.
Which indicator is best for spotting divergence?
Traders reach for the RSI most often because its smooth line makes peaks and troughs easy to compare. The MACD is a close second, read on its histogram or lines. Stochastic and CCI work well too. No single tool is best, so pick one you understand and read it the same way every time rather than switching between several.
Can I trade divergence on its own?
It is risky to trade a divergence alone because many divergences fade without a reversal, especially in strong trends. Treat it as a warning, then wait for confirmation such as a break of structure or a strong reversal candle. That extra step costs a little timing but filters out most of the false signals that trap early entries.
Why do divergences fail so often?
They fail most in powerful trends, which can print divergence after divergence while price keeps running. The tool measures relative momentum, not absolute direction, so fading momentum does not force an immediate turn. A string of failed divergences in one direction usually signals real strength, so confirmation and the higher-timeframe trend keep you on the right side.
What timeframe is best for divergence?
Divergence appears on every timeframe, from the 1-minute to the daily, and the reading method stays the same throughout. Higher timeframes tend to give stronger, more reliable signals with fewer false alarms, while lower timeframes give more signals with more noise. Match the timeframe to your style, and always confirm with the trend one step higher before you commit any risk. Results are not guaranteed; past performance is not indicative of future results.
External references
- For background on this concept, see Divergence at BabyPips Forexpedia.
- For broader market context, see Convergence at Investopedia.

About the author
Written by Dominic Walsh, a Forex trader and MT4/MT5 indicator, Expert Advisor and script developer. Every tool on forexmt4systems.com is tested on live charts before release and ships with ready-to-use compiled MT4 (.ex4) and MT5 (.ex5) files. Learn more about the trader and developer behind this site.
How we build, test and correct every tool: Editorial & Testing Policy. Trading carries risk; see the disclaimer.