
One structure has a classical name and a century of textbooks behind it. The other arrived through price-action forums with a strange nickname, and the quasimodo pattern vs head and shoulders question causes more confusion than it should.
Here is the short answer. A quasimodo breaks the previous pullback low on the way down from the head, while a plain head and shoulders leaves that low intact until the very end.
Quasimodo Pattern vs Head and Shoulders: The Broken Low
Both structures share the same skeleton. A high, a pullback, a higher high, a drop, and then a lower right shoulder near the first high.
Only the depth of that drop differs. In a quasimodo it cuts straight through the pullback low; in the classical shape it stops above it.
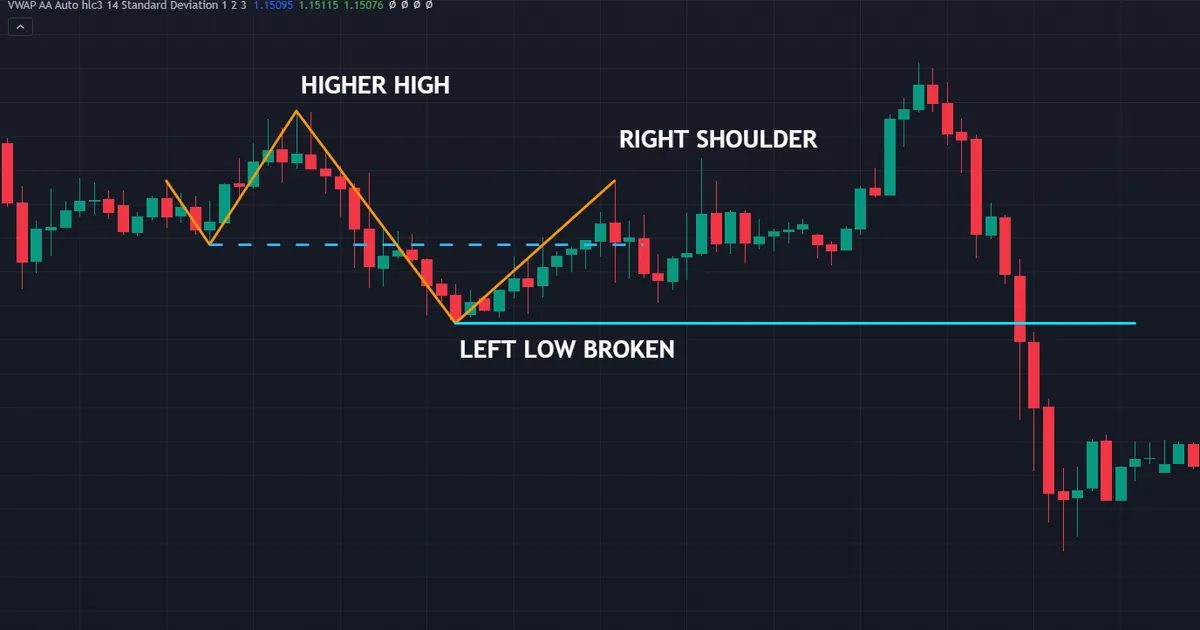
Above sits a quasimodo on EURUSD hourly bars from 21 to 22 July 2026. The pullback low at 1.14090 gave way on the drop from the higher high, which reached 1.13974 before price turned back up to build the right shoulder.
What the Broken Low Changes
In a classical head and shoulders, the neckline holds through the whole formation. Traders wait for a close below it, and that close is the trigger.
A quasimodo takes that low out early. So by the time the right shoulder forms, the structure has already shown lower prices once.
Because of that early break, the two setups trade differently. One waits for a neckline close, the other watches the return to the old high.
Why This Is a Variant, Not a New Discovery
Plenty of articles present the quasimodo as something separate. It is not, and pretending otherwise helps nobody.
Strip the label away and you have a head and shoulders whose left low broke sooner than usual. The anatomy is identical, the naming convention differs, and the price-action community simply gave the early-break case its own word.
Our smart-money guide to the quasimodo pattern covers the same structure in the language traders use for order flow. Reading both angles beats arguing about which name is correct.
How Each Structure Forms, Step by Step
Both sequences run through the same six stages. Only stage four splits them apart.
- A high forms. Price reaches a swing high inside an existing advance and stalls there.
- A pullback low forms. Price retraces, and this low becomes the level that matters most.
- A higher high forms. Buyers push past the first high, which becomes the head of the structure.
- The drop happens. A quasimodo breaks the pullback low here; a plain head and shoulders stops above it.
- The right shoulder forms. Price recovers toward the first high without exceeding the head.
- Confirmation arrives, or it does not. A close below the defining level settles the argument either way.
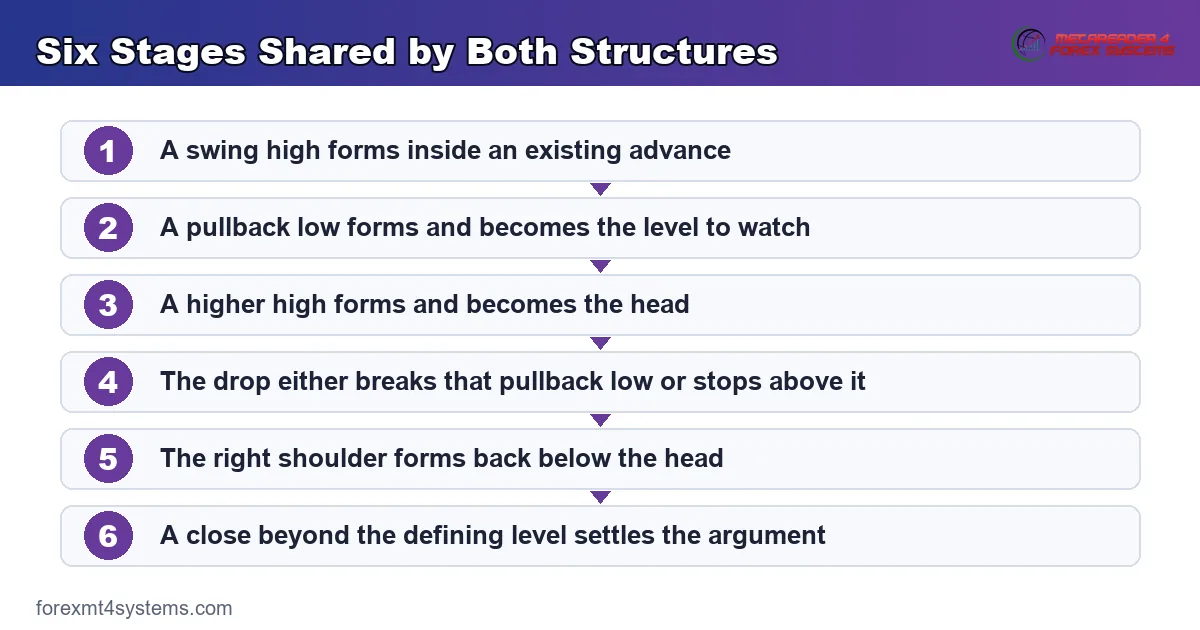
Walk the stages in order every time. Stage four decides which name applies, and everything downstream follows from it.
Where the Right Shoulder Lands
In both structures the right shoulder sits below the head. Traders who follow the quasimodo language look for it near the level of the original high.
That location gives them a reference for entry and a nearby stop. Above the head, the whole idea has gone.
Classical readers care less about the exact height. They accept a right shoulder anywhere near the left shoulder and wait for the neckline instead.
Which Timeframe Owns the Label
An hourly quasimodo often sits inside a single four-hour bar. So the same market supports two different readings depending on where you look.
Pick the chart you actually trade and label there. Hunting across timeframes until a structure appears is how weak setups get talked into a plan.
One lower timeframe still helps for entry timing. Let the higher chart own the label, the level and the stop.
The Classical Sequence in Full
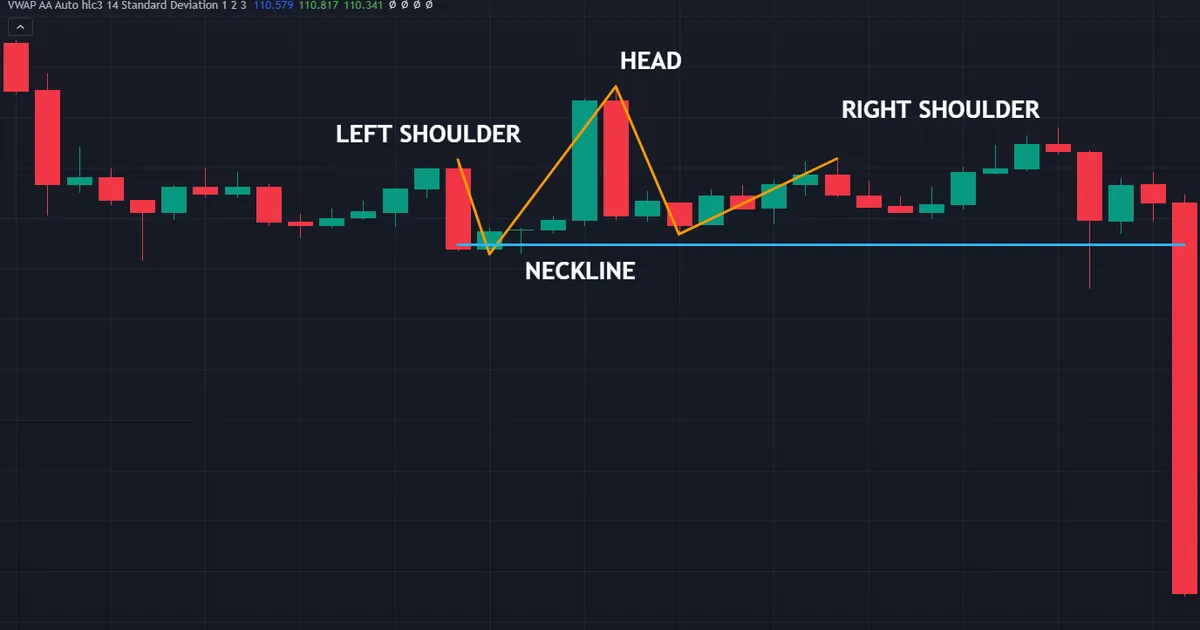
Numbers make the classical version concrete. Consider the head and shoulders on AUDJPY hourly bars between 29 and 30 July 2026.
A left shoulder, a head at 114.120 and a lower right shoulder sat above a neckline at 113.496. The height from head to neckline came to 0.625.
The Neckline Survives Until the End
Notice what did not happen on the way down from the head. Price stopped above the neckline rather than cutting through it.
That is the whole difference. The level held, the right shoulder formed, and only then did the close below it arrive.
Confirmation and the Projection
Confirmation means an hourly close below 113.496, not a wick that pokes at it. Traders who insist on the close pay a worse price for better evidence.
The usual projection subtracts the height from the neckline. Here that arithmetic points toward roughly 112.871, and no further than that.
A measured move is a projection, never a promise. Price frequently stops well short, which is exactly why partial exits exist.
What Each Structure Shows About Orders
Neither shape signals anything. Both describe an argument between buyers and sellers that has already finished.
A Broken Low Leaves Something Behind
When the drop from the head cuts the pullback low, it trades through prices where buyers had recently defended. Stops sitting under that low get filled on the way past.
The chart records that event plainly. Sellers reached deeper than the previous swing allowed, which the classical version never shows.
Our note on liquidity sweeps covers how traders read those flushes through obvious levels.
The Right Shoulder as a Return to Supply
After the flush, price climbs back toward the original high. Sellers who wanted that area before often still want it.
So the right shoulder gives a reference rather than a signal. Traders sell into it with a stop above the head, and the structure fails cleanly if that stop trades.
Nothing here forecasts a drop. The setup simply defines a level, an invalidation point and a size.
Where the Odd Name Came From
The nickname comes from the hunchback of Notre-Dame, because the higher head and the uneven shoulders resemble a stooped figure. Some traders call the same thing an over-and-under pattern, and others just write QM.
Colourful names help memory and nothing else. A label never adds evidence to a chart.
Treat all three terms as synonyms for one structure. Then spend your attention on the level and the invalidation instead.
Where These Structures Carry the Most Weight
Location does more work than shape. A structure that forms somewhere meaningful reads very differently from one floating in open space.
At the End of an Extended Advance
Both shapes need something to reverse. After a long run, buyers have already paid up for hours or days, and fresh demand comes at a premium.
Drop the identical structure into a sideways range and the argument disappears. Nothing about the drawing changed, yet the context that made it interesting has gone.
So check the swing structure first. Two minutes of scrolling left saves a great deal of second-guessing later.
Into a Level That Already Mattered
A head that pokes into an old weekly high carries more weight than one in clear air. Sellers park orders at prices they remember.
Mark those levels before the structure forms. Marking them afterwards invites you to fit the picture to the trade you already wanted.
The right shoulder gains the same way. A return into a level that stopped price before gives the reaction a reason to happen.
Around Session Extremes
Heads often print at the London or New York high of the day. Those extremes attract stops, and stops attract the flush that defines a quasimodo.
Structures built in thin Asian hours deserve more caution. Fewer participants means the swings reflect less genuine disagreement.
Note the session on every screenshot you keep. Patterns in your own results show up quickly once the sample grows.
Mirroring the Structure at a Low
Everything above flips cleanly at a bottom. Simply turn the bearish descriptions upside down and the logic survives intact.
The Bullish Quasimodo
Price makes a low, bounces, then makes a lower low. That rally out of the lower low breaks the previous pullback high, which mirrors the broken pullback low exactly.
The right shoulder then forms back near the original low. Traders buy into that level with a stop below the head.
The Inverse Head and Shoulders
The classical mirror keeps the neckline intact until the end. Confirmation means a close above it rather than below.
Everything else carries over unchanged. The projection, the partial exits and the honest limits all apply the same way.
Managing the Trade After Entry
Entry gets most of the attention and decides least. What happens over the following bars matters far more to the result.
The First Test Tells You Plenty
Watch how price behaves at the level immediately after entry. A slow grind against you reads very differently from a sharp rejection in your favour.
Neither observation carries a number worth quoting. Both simply help you decide whether to hold, trim, or step aside early.
Partial Exits and the Projection
Taking part of the position off near the halfway mark solves a real problem. Price stops short of measured moves often enough that waiting for the full target costs traders plenty.
The remainder then runs with less pressure. A stop moved to the entry price after a partial exit turns the trade into a low-stress hold.
Neither habit improves the structure itself. They simply change what a given outcome does to your account.
When to Abandon the Idea Early
Sometimes price neither triggers your stop nor moves your way. It sits at the level for twenty bars and does nothing at all.
Set a time limit in advance for that case. Freeing the capital beats staring at a chart that stopped arguing hours ago.
Download the complete indicator database
Put these concepts on your charts. One email unlocks the full library of 1,380+ indicators with compiled MT4 and MT5 files, plus my TradingView scripts. No paywall, no spam, unsubscribe any time.
Get free access to my indicator database
One email unlocks 1,380+ free MT4, MT5 and TradingView indicators — the complete library. No single-tool download; you get the whole database.
Common Mistakes and Their Fixes
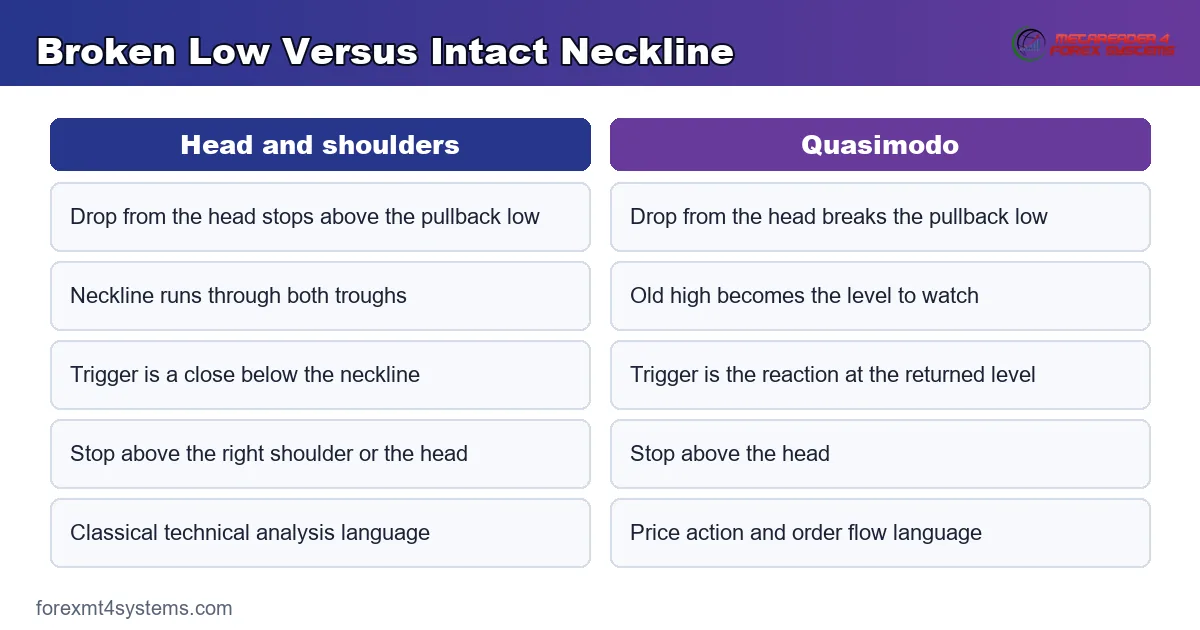
Six errors cause most of the trouble here. The panel below sets the broken-low case and the intact-neckline case side by side.
Treating the Quasimodo as a Separate Discovery
The structure is a head and shoulders with an early break. Learn the classical anatomy first, and the variant costs you five extra minutes.
Ignoring Which Low Actually Broke
Traders often mark the wrong low. The level that matters is the pullback low between the first high and the head, nothing else.
Selling the Right Shoulder Without a Level
A right shoulder floating in open space carries little weight. Our guide to market structure shows how to mark the swings that give it context.
Entering on a Wick Rather Than a Close
Touches prove attempts, closes prove agreement. Wait for a close beyond the defining level on your working timeframe before you commit anything.
Placing the Stop Too Close to the Shoulder
A stop a few points above the right shoulder sits inside normal noise. Above the head costs more room, yet it matches where the idea genuinely dies.
Skipping the Failure Case
Both structures break the wrong way regularly. Our capstone on why chart patterns fail gathers the reasons in one place.
Quick Reference: Which One Are You Looking At
Keep this table beside the chart until the check becomes automatic. Row three does the sorting.
| Check | Head and shoulders | Quasimodo |
|---|---|---|
| Left shoulder | Swing high inside an advance | Swing high inside an advance |
| Head | Higher high | Higher high |
| Drop from the head | Stops above the pullback low | Breaks the pullback low |
| Right shoulder | Near the left shoulder height | Near the original high level |
| Defining level | The neckline through both troughs | The old high the shoulder returns to |
| Trigger | Close below the neckline | Reaction at the returned level |
| Stop reference | Above the right shoulder or the head | Above the head |
| Common language | Classical technical analysis | Price action and order flow |
Start at row three every time. Once you know whether the low broke, the rest of the table follows.
Turning the Difference Into a Written Rule
A structure you label by feel drifts with your mood. Writing the test down turns an impression into a plain yes or no.
Mark the Pullback Low Before the Head Forms
Draw a horizontal line at the pullback low as soon as it prints. Then the answer arrives automatically when the drop from the head happens.
Marking it afterwards invites hindsight. You will pick whichever low makes the chart look like the pattern you already wanted.
Write One Confirmation Rule for Each
For the classical shape, confirmation means a close below the neckline. For the quasimodo, most traders use a reaction at the returned level with a stop above the head.
Both rules work. Choosing between them mid-trade does not, so settle the question before the structure appears.
Size From the Stop Distance
A quasimodo stop above the head can sit far from the entry. Fixed lot sizes therefore hand you very different exposure without any decision on your part.
Work the size from the distance instead. Our trade risk visualiser shows what a given stop and size actually put at stake.
When the Structure Does Not Follow Through
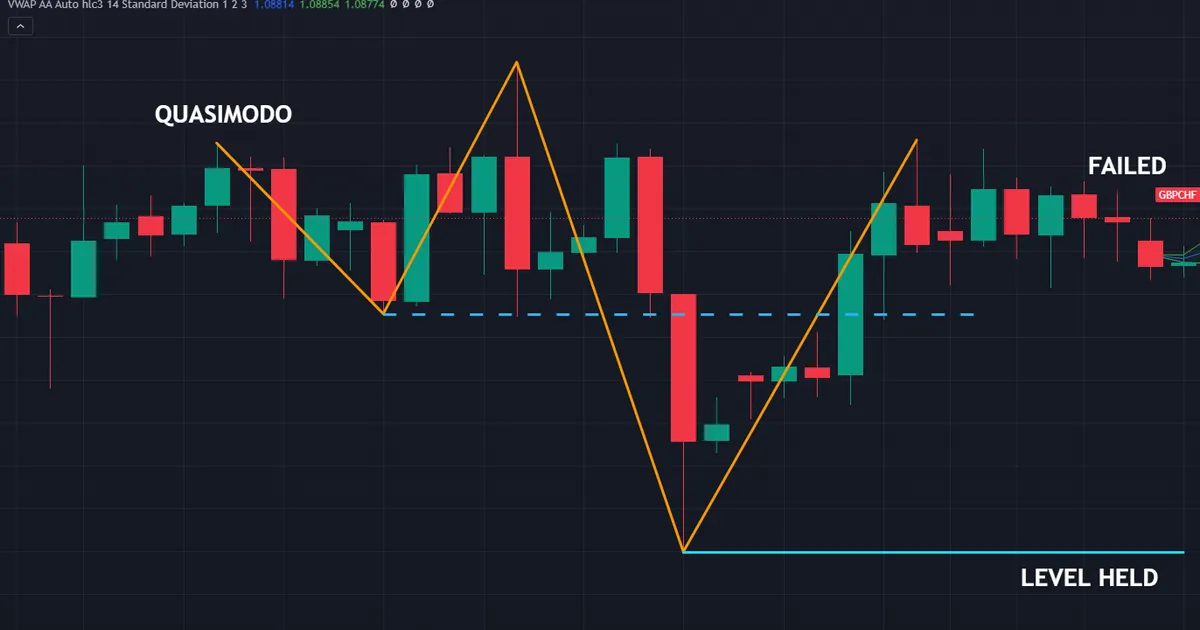
Failures teach more than tidy examples. Below sits a quasimodo on GBPCHF four-hour bars, running from 28 to 31 July 2026, that never gave the entry the structure promises.
What Actually Happened
Every stage arrived on schedule. The pullback low at 1.08654 broke on the way down from the head, the drop reached 1.08098, and the right shoulder formed back near the old high.
Then nothing happened. Price never closed back beneath 1.08098, so the trigger the pattern depends on never fired and no short was ever valid.
Check the solid level line on the chart. After the right shoulder the deepest print was 1.08714, some 62 pips above the low that would have started the trade.
Why That Outcome Is Normal
A structure describes orders that already traded. Fresh orders arrive afterwards, and they owe nothing to the shape on your screen.
Sellers who defended the old high may have finished. Buyers may have waited precisely for the flush below the pullback low. Neither group announces itself.
How to Trade Around That Reality
Define invalidation before entry, then size so a loss feels dull. A structure that fails should cost you a shrug rather than a bad month.
Treat a setup that never triggers as the rules doing their job. Waiting for a close beneath 1.08098 kept you flat, and an untouched level stays a reference until price finally resolves it.
Failure Versus Mistake
A structure that fails is not the same as a bad decision. You can mark the low correctly, wait for the reaction, size sensibly, and still lose.
Judge the process rather than any single outcome. Only a run of thirty or forty entries says anything useful about your rules.
What a Cluster of Failures Tells You
One failure means nothing at all. Five in a row on the same pair suggests either the market changed character or your marking drifted.
Go back through the screenshots when that happens. Usually the heads got shallower, or the shoulders formed further from the old high, long before the losses arrived.
Why the Honest Framing Helps
Traders who expect a structure to work feel betrayed when it does not. That feeling drives revenge entries, oversized positions and abandoned plans.
Expecting a mixed record instead keeps the process calm. A shape is a way to frame a level, and framing a level was never a promise about the next hour.
Related Guides Worth Reading Next
These structures sit inside a family of reversal shapes built from swing highs and lows. A few neighbouring guides finish the picture.
Start with our full anatomy piece on the head and shoulders pattern, then flip it over with our how-to on the inverse head and shoulders. Our guide to the double top pattern covers the simpler two-peak case that often precedes both.
Traders who want these swings marked automatically can browse our price action indicators archive. Treat any such tool as a spotter, and keep the labelling decisions in your own hands.
Automated pattern tools carry one specific risk here. They use a fixed swing setting, so a slightly different lookback turns the same bars into a different structure entirely.
Open the chart when an alert fires. Mark the pullback low yourself, check whether the drop from the head really closed below it, and only then decide what you are looking at.
FAQ
Is a quasimodo just a head and shoulders?
Essentially, yes. Both structures use a high, a pullback, a higher high and a lower right shoulder. The quasimodo is the case where the drop from the head breaks the previous pullback low before the right shoulder forms. Price-action traders gave that early-break variant its own name, and the underlying anatomy stayed the same.
Which low do I need to watch?
The pullback low between the first high and the head. Mark it with a horizontal line as soon as it prints. If the drop from the head closes below that line, you have a quasimodo. If the drop stalls above it, you have the classical shape and the neckline still matters.
Where does the entry go on a quasimodo?
Most traders use the return to the original high, since the right shoulder tends to form near that level. The stop then sits above the head, because a move past the head removes the whole argument. Waiting for a rejection candle at the level rather than entering blind adds evidence at a small cost in price.
Does the right shoulder have to match the left one?
Not exactly. Classical descriptions ask for a right shoulder roughly near the left shoulder’s height, and real charts rarely oblige neatly. Treat a right shoulder that stays well below the head as acceptable, and judge the structure on the level it returns to rather than on symmetry.
Can a quasimodo appear on any timeframe?
It can, from one minute to weekly. Higher timeframes produce fewer structures with cleaner swings, while lower ones produce many more with far more noise around each level. Pick the chart you actually trade, mark the pullback low there, and resist the urge to hunt across timeframes until a structure appears.
Does the name change how the market behaves?
No. Labels help traders talk to each other, and nothing more. Two people looking at the same swings may call the structure a quasimodo, an over-and-under, or simply a head and shoulders with an early break. The level, the invalidation point and the position size do all the real work.
How reliable are these structures?
Nobody can give you an honest figure. Published testing of classical chart shapes has produced modest and inconsistent findings once transaction costs and drawing choices enter the picture, and outcomes shift with the market, the period and the exact rules applied. Treat both structures as a way to frame a level and a stop, then let confirmation and position size carry the load. Results are not guaranteed; past performance is not indicative of future results.
External references
- For background on this concept, see Apophenia on Wikipedia.
- For broader market context, see Head and Shoulders at BabyPips Forexpedia.

About the author
Written by Dominic Walsh, a Forex trader and MT4/MT5 indicator, Expert Advisor and script developer. Every tool on forexmt4systems.com is tested on live charts before release and ships with ready-to-use compiled MT4 (.ex4) and MT5 (.ex5) files. Learn more about the trader and developer behind this site.
How we build, test and correct every tool: Editorial & Testing Policy. Trading carries risk; see the disclaimer.