
An inverse head and shoulders pattern gives you three concrete decisions: where to enter, where the stop belongs, and how far to project the move. This guide leads with those decisions rather than the drawing lesson.
The shape itself mirrors the topping version exactly, so our companion guide to the head and shoulders pattern meaning covers the anatomy in depth. Read this one for the execution.
Trading the Inverse Head and Shoulders Pattern: The Short Version
Three lows form after a decline. The middle low digs deepest, and the two beside it sit at a similar, shallower depth.
A line across the two intervening peaks becomes the neckline. Everything you do next hangs on that line.
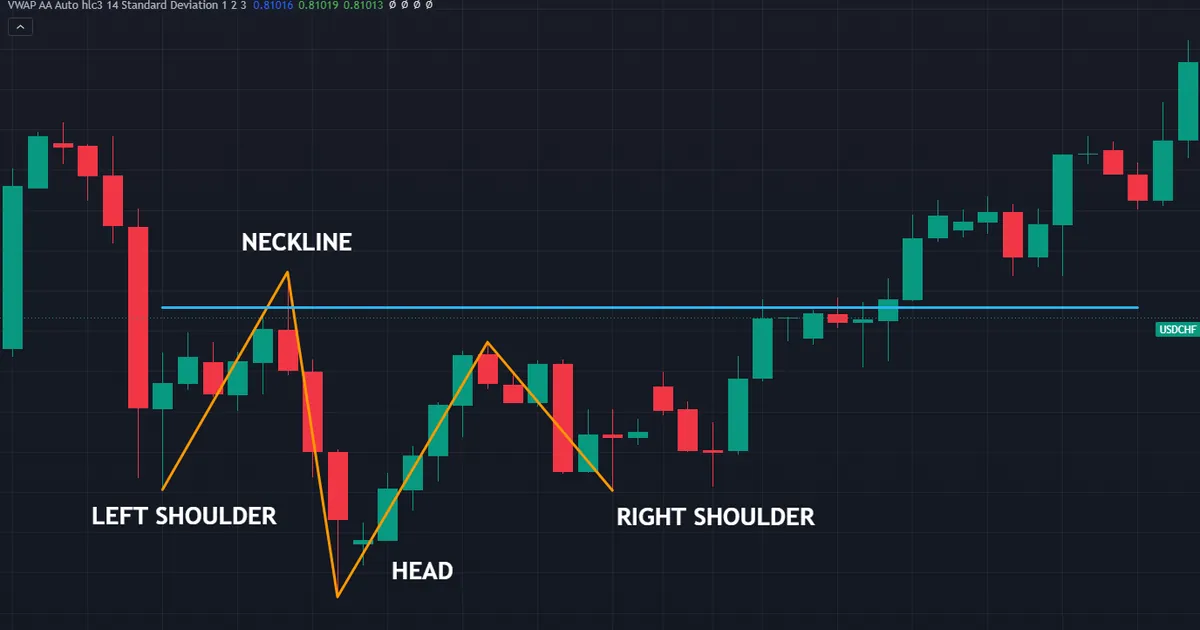
The chart above shows the structure on USDCHF four-hour bars, with the head at 0.8034 and the neckline at 0.81059. Left shoulder, head and right shoulder all sit below the line, which is the arrangement worth waiting for.
The Trigger
Enter on a close above the neckline, never on a touch. Price pierces levels constantly, and the settled close carries the information a wick does not.
Use the timeframe that drew the shape. A four-hour formation needs a four-hour close, not a five-minute one.
The Stop
Most traders place it below the right shoulder. That level sits far enough away to survive ordinary noise while still invalidating the read if it breaks.
Deeper stops go under the head. They cost more per trade, so the position has to shrink to keep the risk identical.
The Target
Measure from the head up to the neckline, then project that distance above the break. Treat the result as a projection rather than a destination.
Price often stops short of it. Partial exits exist for exactly that reason, and the sections below work through the arithmetic on a real example.
The Execution Sequence, Step by Step
Run the same sequence on every candidate. Six steps take you from a drawn line to a managed position.
- Confirm the prior decline. A genuine downtrend must lead into the left shoulder.
- Draw the neckline. Run it across the two peaks between the lows, then leave it alone.
- Set the alert. Place it at the neckline so you watch the close rather than every bar.
- Wait for a close above. Any wick through the line completes nothing.
- Measure and size. Take the head-to-neckline height, then size from your stop distance.
- Place the order and the stop. Stop below the right shoulder, target one height above the break.
Step four rejects most candidates, and that is the point. Because breaks fail often, the close does the filtering that patience alone cannot.
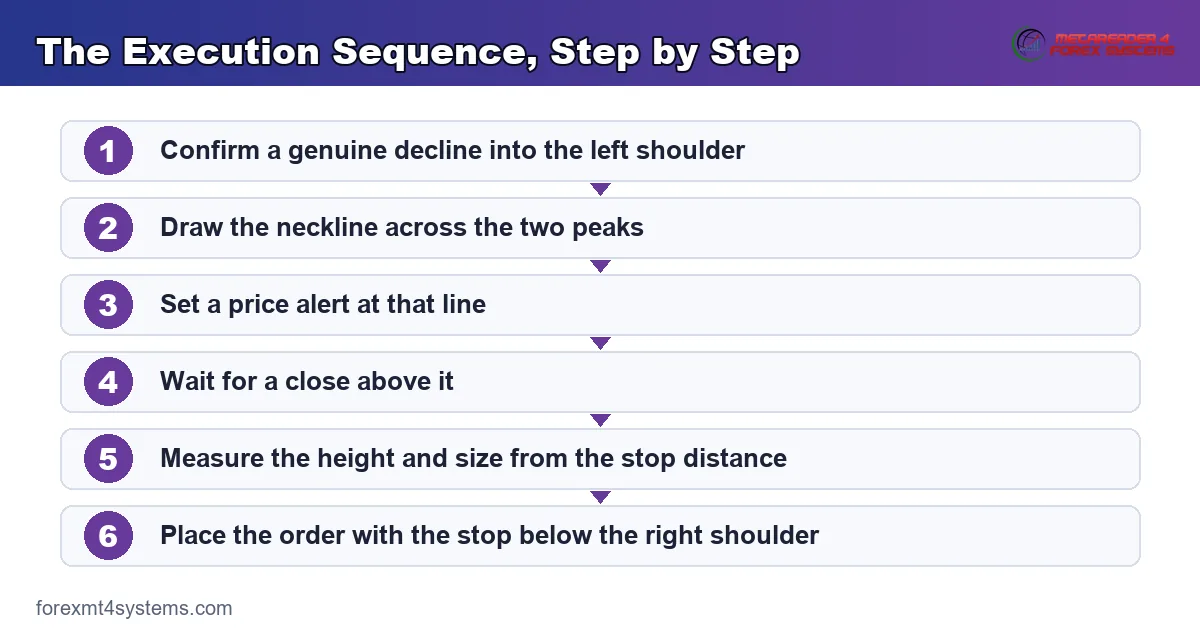
Keep the order fixed. Traders who size the position before checking the stop distance end up risking whatever the chart happened to allow.
Entry: Why the Close Above the Neckline Rules
A neckline works like any other level. Price tests it, pokes through it, and only a settled close tells you which side won the exchange.
Wicks Through Versus Closes Above
Thin liquidity produces spikes constantly. A poke a few pips above the line often reverses within the hour and leaves nothing behind.
A close above changes who holds the pain. Traders short from either peak now sit underwater, and their covering adds to the buying.
So write the rule into your plan in advance. Otherwise the temptation to act early arrives exactly when the chart looks most exciting.
Which Timeframe Supplies the Close
Match the trigger to the chart that drew the shape. Dropping down for an earlier entry sounds clever and costs consistency.
Lower timeframes also multiply false breaks. One weekly close carries more information than forty five-minute closes around the same line.
How Long to Give the Break
Add a time stop beside the price stop. A break that stalls for several bars without extending rarely improves with more waiting.
Scale the patience to the timeframe. Weekly structures deserve weeks, while four-hour ones deserve a session or two at most.
The Retest and the Second Entry
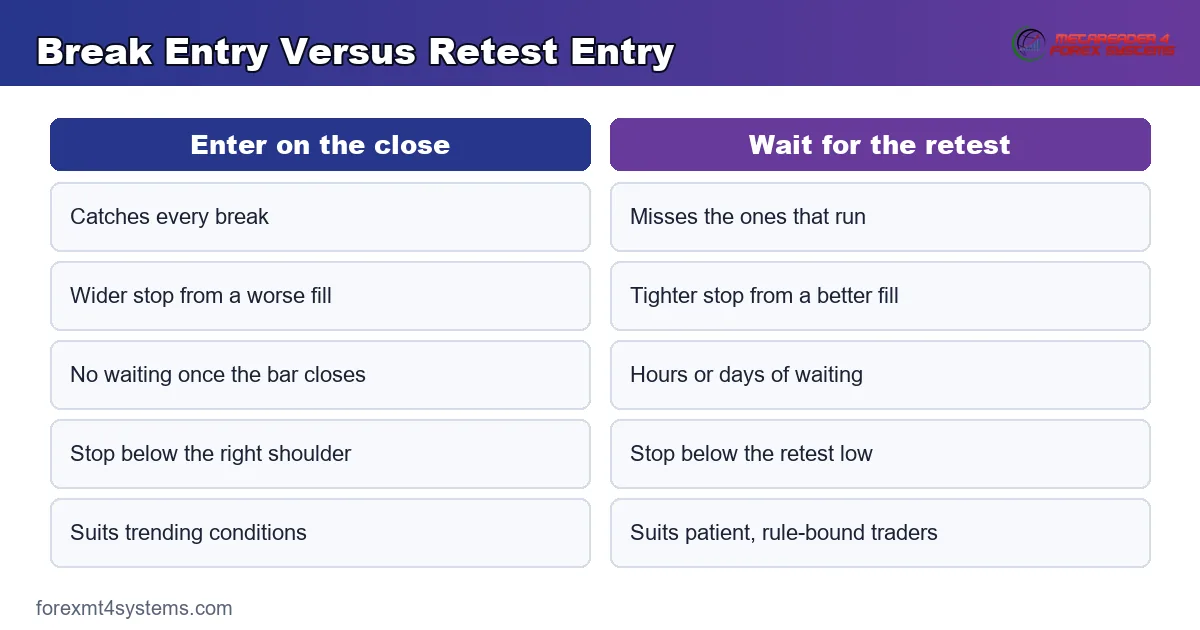
Plenty of breaks come back to the line before running. That return offers a tighter stop, and it also offers a chance to miss the trade.
What the Retest Looks Like
Price drifts back to the neckline and stalls there. Old resistance now acts as support, which is the behaviour the entry relies on.
Watch the bars at the line rather than the line itself. A rejection candle closing back above it says buyers defended the level, and our note on the engulfing candle covers one of the clearer shapes to look for.
When the Retest Never Comes
Some breaks simply run. Waiting for a pullback that never arrives means watching the whole measured move from the sidelines.
Decide in advance which cost you prefer. Missing trades and taking wider stops are both real costs, and no rule removes them both.
Splitting the Order
Half on the close and half on a limit at the neckline resolves the argument. Both halves share a single stop below the right shoulder.
Size the two halves as one position. Otherwise the second fill quietly doubles your risk on the trades that come back.
Reading the Base Before You Commit
Not every three-low arrangement deserves a trade. Grading the base before the close arrives saves far more than any entry refinement.
Depth of the Head
The head should dig clearly below both shoulders. A middle low that barely undercuts them describes a flat range instead of a base.
Clarity matters more than proportion. If you have to squint to decide which low is deepest, the label does not apply and the trade can wait.
Symmetry of the Shoulders
Shoulders at a similar depth read cleanly. Both attempts to sell failed near the same price, which is the behaviour the structure records.
Rough symmetry in time helps as well. Shoulders of wildly different duration usually mean two unrelated swings sharing a chart.
Set a tolerance and apply it every time. Judging each case by feel produces a record you cannot learn from later.
The Slope of the Neckline
Downward-sloping necklines flatter the setup. They trigger sooner, and sometimes on a bar that reverses immediately afterwards.
Upward-sloping necklines delay the entry. By the time price closes above one, much of the move may already sit behind you.
Draw the line once, then screenshot the chart. That habit keeps your later self from quietly improving the picture.
Where the Base Sits
A base at an old floor carries weight. Three lows in open space carry rather less, whatever the shape looks like.
Check the higher chart for that history before drawing anything. Location does more work than symmetry ever will.
Grading the Candidate in One Minute
Score four things quickly: prior decline, head clarity, shoulder symmetry and level history. Three out of four usually justifies an alert at the neckline.
Two out of four usually justifies nothing. Skipping those cases costs you a handful of trades and saves a longer list of avoidable losses.
Write the score in your journal beside the chart. Patterns you graded honestly become far more useful evidence than patterns you remember fondly.
Placing the Stop
Stop placement decides the size, and size decides the outcome far more than entry precision does.
Below the Right Shoulder
This placement suits most traders. It keeps the distance manageable, and a break of the right shoulder low genuinely damages the read.
Add a little room beneath the obvious low. Stop clusters gather right under it, and price reaches them more often than any diagram suggests.
Below the Head
A stop under the head survives almost any shakeout. It also widens the risk considerably, which forces a much smaller position.
Compare the two placements before choosing. Our ATR position size calculator converts recent volatility into a stop distance you can test against both options.
Sizing From the Stop Distance
Fix the money at risk first, then let the stop distance decide the lots. Never let a wide stop tempt you into a wider loss.
Our position size calculator handles the arithmetic in a couple of clicks. Run it before the close arrives rather than during the excitement.
The Measured Move on a Weekly Chart
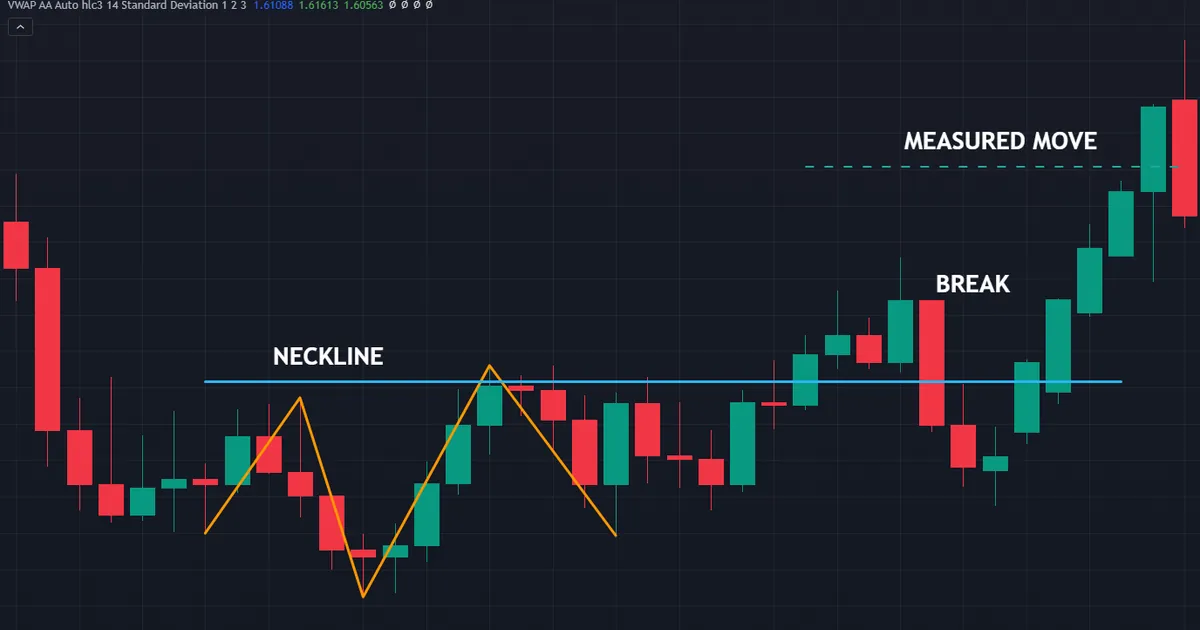
Weekly examples show the projection at its clearest, because each swing takes real time to build. The chart below tracks a completed break on EURCAD weekly bars.
Working the Numbers
Its head sits at 1.4462 and the neckline runs at 1.4758. Subtract one from the other and the height comes to 0.0296, or roughly 296 pips.
Add that distance to the neckline and the measured move lands near 1.5054. That figure becomes a reference, not a forecast.
Check the ratio before committing. A stop below the right shoulder and a target 296 pips away either justify the trade or they do not.
Why Price Often Stops Short
Obstacles sit in the way. Old swing highs, round numbers and session extremes all attract profit taking long before any projection arrives.
Volatility shapes the outcome too. A 296 pip target asks a great deal of a quiet month and rather less of a fast one.
So mark the obstacles between entry and target first. Then decide which of them deserves a partial exit rather than holding for the full measure by default.
Partial Exits and the Trail
Book a slice at the first obstacle. Taking money off the table early makes holding the remainder through an ordinary pullback far easier.
Trail the rest behind structure. Each new higher low above the neckline supplies a fresh reference, so the market sets the pace instead of a fixed distance.
Download the complete indicator database
Put these concepts on your charts. One email unlocks the full library of 1,380+ indicators with compiled MT4 and MT5 files, plus my TradingView scripts. No paywall, no spam, unsubscribe any time.
Get free access to my indicator database
One email unlocks 1,380+ free MT4, MT5 and TradingView indicators — the complete library. No single-tool download; you get the whole database.
Managing the Trade After Entry
Entry solves half the problem. What happens over the following sessions decides most of the result.
The First Few Bars
Watch whether price holds above the neckline. A close back below it, soon after the break, undoes the whole read.
Do nothing rash in the meantime. Sideways drift above the line remains perfectly normal behaviour for a fresh break.
Moving the Stop
Leave the stop alone until the chart offers a reason. A first higher low above the neckline gives you one.
Then trail behind structure rather than by a fixed number of pips. Each new higher low supplies a fresh reference point.
Resist moving to breakeven too early. An ordinary retest would stop you out at the exact moment the setup behaves as described.
Scaling Out
Mark the obstacles between entry and target before the trade starts. An old swing high, a round number and a session extreme all deserve a note.
Take a slice at the first of them. Booking part of the position early makes holding the rest through a pullback far easier.
Keeping the Record
Log where price actually stopped on every attempt. Over enough examples your own notes tell you how far these moves tend to travel on your pairs.
That record beats any general claim about the structure. It also reflects your spreads, your timeframes and your patience rather than someone else’s.
Common Execution Mistakes and the Fixes
Most damage around this setup comes from a handful of habits. The comparison below weighs the two entry styles that cause the most argument.
Buying the Right Shoulder in Anticipation
Three lows alone describe a base, not a completed structure. Buy the right shoulder if your plan allows range trading, but log it as a range trade.
Redrawing the Neckline Until It Breaks
Tilting the line until a close clears it defeats the exercise. Anchor it at the two peaks, then leave it in place whatever happens next.
Sizing Before Measuring the Stop
Position size follows stop distance, never the other way round. A wide stop with a normal lot size turns a routine loss into a memorable one.
Chasing the Break Several Bars Late
Entering well above the neckline shrinks the reward and stretches the stop. Wait for the retest instead, or skip the trade and keep the discipline.
Ignoring the Higher Timeframe
A four-hour base inside a firm weekly downtrend fights the larger flow. Our guide to multi-timeframe analysis covers how to check the bigger chart before committing.
Holding for the Full Projection Regardless
The measured move offers a reference point. Take partial profit at obvious levels along the way, then let a trailing stop handle the remainder.
Inverse Head and Shoulders Quick Reference
Keep this table beside the chart while the routine becomes habit. Each row states a condition rather than an outcome.
| Decision | What to check | Common practice |
|---|---|---|
| Prior trend | A real decline into the left shoulder | Weeks or months, not days |
| Neckline | Line across the two peaks | Drawn before the right shoulder completes |
| Trigger | A close above the neckline | Close on the timeframe that drew the shape |
| Second entry | Retest of the line as support | Limit order at the neckline, same stop |
| Stop | Below the right shoulder low | Extra room for a stop run |
| Size | Risk fixed, lots derived | Calculated before the close arrives |
| Target | Head-to-neckline height above the break | Partial exits at levels along the way |
Notice what the table omits. Nothing here suggests how often the structure follows through, because that figure shifts with the market, the period and the definition applied.
When the Setup Fails
Failures teach faster than clean examples. The chart below shows a base on EURGBP four-hour bars that never triggered: the head printed at 0.85088, yet the neckline at 0.8541 held and the pattern failed.
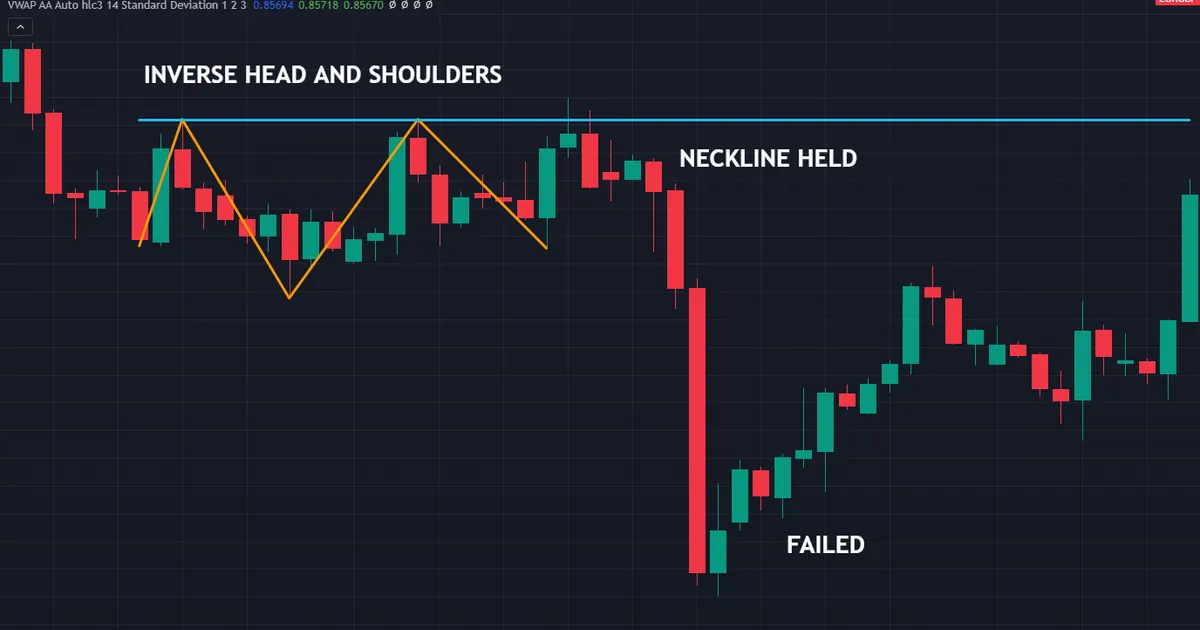
The Neckline Simply Holds
Without a close above the line there is no trade to take. Traders who bought in anticipation become the supply that pushes price back down.
Small structures fail this way constantly. A 32 pip height leaves little room for error, and spreads consume a meaningful share of it.
The Right Shoulder Gives Way
Sometimes sellers press before the break. A close below the right shoulder low ends the read, whatever the shape looked like an hour earlier.
Treat that level as your invalidation and honour it. Arguing with a chart costs more than accepting a small loss.
The Break Came on a Wick
Traders who act on a spike through the line take a trade the structure never offered. Wait for the close, and most of these failures never reach your account.
News Overrode the Structure
A rate decision or a surprise print erases any chart shape. Check the calendar before planning a trade around a level near a scheduled release.
The Level Never Mattered
Three lows in open space attract far less business than three lows at an old floor. Check whether price reacted at that price before the base formed.
The Break Ran Into a Bigger Ceiling
Sometimes the close clears the neckline and stalls a few pips later. A weekly resistance band sitting just above the line explains most of those cases.
Look up a timeframe before entering. If a major level sits between your entry and the projection, shrink the target rather than the stop.
The Structure Formed in Thin Hours
Bases built during quiet Asian sessions often unravel when London arrives. Note which session produced each low, then treat a thin-hours break with extra caution.
Volume patterns cannot help much on currency feeds. Session timing gives you a rougher but more honest read of who was actually present.
Where This Sits Beside Its Relatives
Several bullish base structures share the same logic. Knowing which one you hold keeps your records clean and your rules consistent.
Two lows and one peak make a different shape. Our guide to the double bottom pattern covers that version, where the neckline sits at the single peak between the lows.
Rounded bases behave differently again. The cup and handle replaces the three distinct lows with one smooth curve, then adds a shallow pullback before the break.
Context decides which reading matters. Our trend indicators archive collects the tools traders use to judge whether the larger flow supports a base at all.
One habit outranks all of this labelling. Spend your study time on levels that already turned price, because a base at a meaningful floor beats a textbook shape in open space every session.
A Note on What This Structure Is Not
The shape describes what already happened. It records three failed pushes lower, and nothing about that record predicts the next hundred bars.
Published testing of classical chart patterns has produced modest and inconsistent results. Outcomes shift with the market tested, the period chosen and the exact definition applied, so treat any confident figure with suspicion.
Use the structure as a framework instead. It supplies a trigger, an invalidation level and a projection, which is enough to build a repeatable process around.
FAQ
What is an inverse head and shoulders pattern?
It describes three lows after a decline, with the middle low deeper than the two beside it. A line across the two intervening peaks forms the neckline, and only a close above that line completes the structure.
Where exactly do I enter?
On the close above the neckline, on the timeframe that drew the shape. A second entry on the retest of that line offers a tighter stop, and splitting the order across both removes the need to choose.
Where does the stop belong?
Below the right shoulder low for most traders, with a little room for a stop run. A deeper stop under the head survives more noise, so shrink the position accordingly to keep the risk unchanged.
How do I calculate the target?
Measure from the head up to the neckline, then project that distance above the break. Treat the number as a projection, mark the obstacles between entry and target, and take partial profit along the way.
Does the pattern need volume confirmation?
Not on forex, where feeds report tick counts rather than traded size. Momentum readings across the three lows give a more useful second opinion, and a level with genuine history matters more than either.
What invalidates the setup?
A close back below the neckline after the break, or a close under the right shoulder low before one happens. Either outcome says sellers took the level back, so the read no longer stands and the trade closes.
Which timeframe suits it best?
Daily and weekly charts produce the cleanest examples, since each low takes real time to build. Intraday versions appear constantly, yet spreads eat a larger share of the smaller measured move, so treat them with more caution.
Does the inverse head and shoulders work in forex?
It appears regularly on currency charts across every major pair. No chart shape carries a dependable edge on its own, so pair it with a level that already mattered, a written trigger and sensible sizing. Keep a log of every one you trade, because your own record teaches you more than any general article can. Results are not guaranteed; past performance is not indicative of future results.
External references
- For background on this concept, see Inverse Head and Shoulders at Investopedia.
- For broader market context, see Head and Shoulders Bottom at StockCharts ChartSchool.

About the author
Written by Dominic Walsh, a Forex trader and MT4/MT5 indicator, Expert Advisor and script developer. Every tool on forexmt4systems.com is tested on live charts before release and ships with ready-to-use compiled MT4 (.ex4) and MT5 (.ex5) files. Learn more about the trader and developer behind this site.
How we build, test and correct every tool: Editorial & Testing Policy. Trading carries risk; see the disclaimer.